Key takeaways
- There are 18 essential recruiting metrics that you should be tracking in areas like sourcing, candidate pipeline, recruitment performance, return on investment, and other miscellaneous categories.
- Recruiting metrics measure candidate sourcing and pipeline efforts, overall recruiting performance, and ROI.
- Recruitment software automates the metrics’ measurement process in real-time, significantly reducing the manual workload for recruitment teams.
- Feb. 17, 2024: Irene Casucian reviewed the information on this page for accuracy and authority. She expanded the list of metrics
What are recruiting metrics?
Recruitment metrics are measurements you can use to determine the efficiency and effectiveness of your hiring processes. As businesses grow beyond the need for occasional hires, gathering and analyzing these recruitment data helps you streamline your hiring processes.
Recruitment metrics are important to track because they can:
- Help you see the success of your hiring efforts.
- Assist you in planning and monitoring recruitment spending for various positions.
- Determine inefficiencies and bottlenecks in your hiring pipeline.
- Provide insights around diversity, equity, and inclusion (DEI) hiring practices.
- Measure the effectiveness of your candidate sources.
- Support candidate engagement and retention.
Layering recruiting metrics with effective hiring strategies can take your recruitment process to the next level. Check out our 5 Employee Recruitment Strategies To Improve Your Hiring Process video to start optimizing your hiring procedures.
Which recruiting metrics should you measure?
You can decide which recruiting metrics to track based on your unique business objectives. There are many metrics to choose from, but layering metrics from these categories can help optimize recruitment processes and initiatives.
Sourcing metrics
Sourcing metrics measure where and how candidates enter a company’s recruitment funnel.
- Source of hire.
- Source of application.
- Sourcing channel effectiveness.
- Employee referrals.
Candidate pipeline metrics
Candidate pipeline metrics are tied to the amount of time a candidate remains in your recruitment pipeline.
- Time to fill.
- Time to hire.
- Candidate response time.
Recruitment performance metrics
Recruitment performance metrics will help you determine the effectiveness of your recruitment strategies and pinpoint areas needing improvement.
- Applicants per opening.
- Application completion rate.
- Percentage of open positions.
- Offer acceptance rate.
- Interview-to-hire ratio.
- Recruitment funnel effectiveness.
Return on investment metrics
Return on investment metrics will help you gauge if the money you are investing in your recruiting efforts is paying off.
- Sourcing channel cost.
- Cost per hire.
- Quality of hire.
Miscellaneous metrics
These metrics do not fall into other recruiting metric categories, but they help uncover essential insights about the company’s recruitment experience.
- Satisfaction scores.
- Candidate demographics.
1. Source of hire
Measurement: Number of candidates from a sourcing method.
Source of hire indicates how candidates enter your recruitment pipeline, whether through job boards, employee referrals, job fairs, recruitment agencies, or other channels such as social media. This metric, when combined with others, such as the number of hired candidates by source, provides detailed insights that allow you to identify which sourcing methods are most effective in attracting and hiring quality candidates. This helps you form more strategic resource allocation and budgeting toward the most successful sourcing channels.
For example, if a tech company finds that 60% of its best-performing software developers were hired through employee referrals, it can opt to enhance its referral program. You can do this by increasing incentives for employees to refer candidates or promote the program more actively within the company.

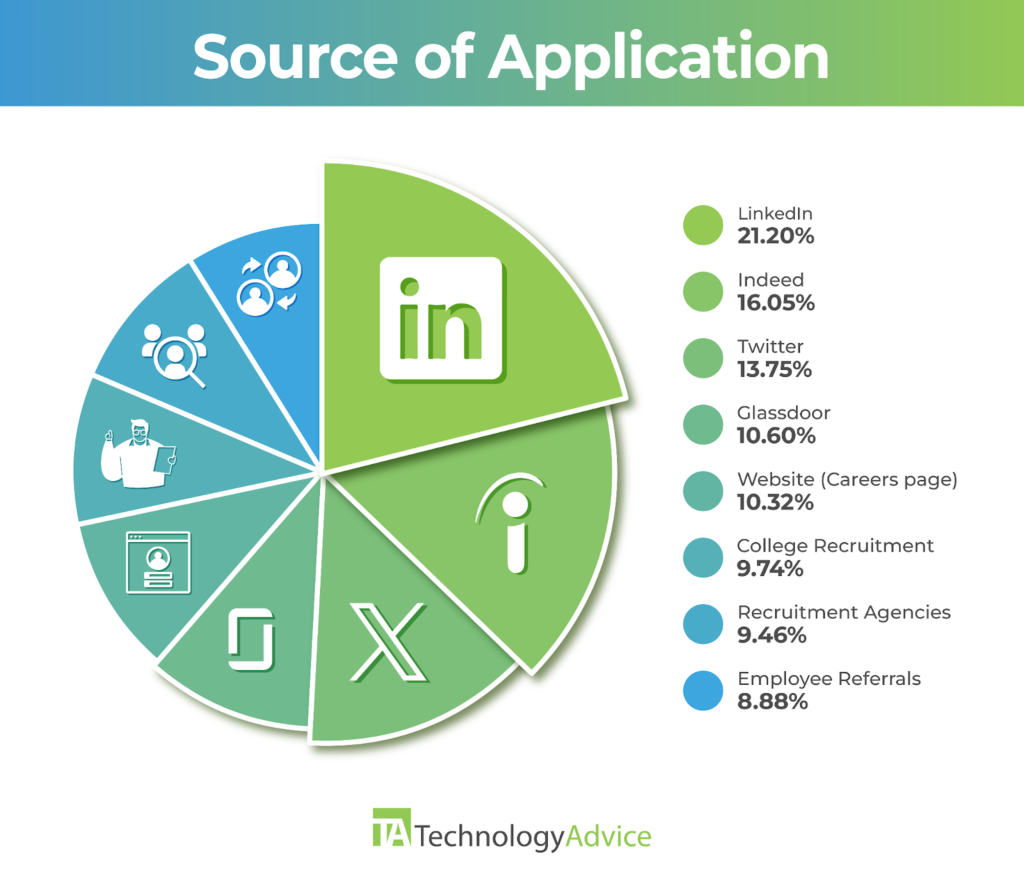
2. Source of application
Measurement: Number of applications from a sourcing channel.
Source of application specifies the exact channel where the application came from. For example, a candidate’s source of hire may be an online job board but the source of application is LinkedIn. Understanding the source of application, mainly when you analyze them alongside the costs associated with different recruitment channels, helps optimize your outreach and engagement efforts.
For instance, by comparing the cost-effectiveness of advertising on platforms like ZipRecruiter and Indeed—where you might spend $30 and receive 70 applications from the former versus $50 to receive 200 applications from the latter—you can assess which platform offers better value per application. This analysis helps you decide how you can allocate your recruitment budget more efficiently, though determining the quality of hire from each source adds another crucial layer to this strategy.
3. Sourcing channel effectiveness
Measurement: Total number of hires via one source channel divided by the total number of applicants from that channel, multiplied by 100.
Formula: Sourcing channel effectiveness = (Number of hires from one source channel / Number of applicants from this channel) x 100
Example:
- Number of hires from LinkedIn: 14
- Number of applicants from LinkedIn: 162
- Formula = (14/162) x 100
- Sourcing channel effectiveness: 8.64%
Sourcing channel effectiveness helps determine which ones produce the most qualified candidates based on their hiring success rates.
For example, if 25% of your successful engineering hires come from an industry-specific networking site, this suggests it’s a strong source for such candidates. However, if a broader channel, like Indeed, has a higher success rate or contributes significantly to the remaining 75% of hires, it might also warrant further investment. Evaluating multiple channels allows you to make strategic allocation decisions for your recruitment resources.
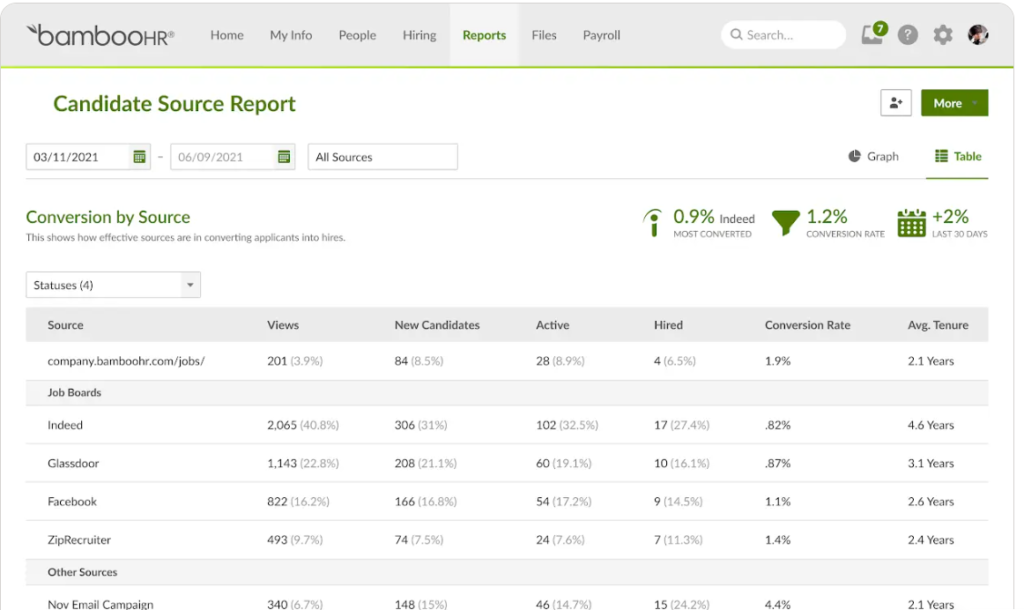
By generating a report, like conversion by source, you can identify how many applicants, in terms of number and percentage, came from a specific source and how many of those were hired. Applicant tracking software can automate this process by tracking each candidate’s journey from application to hire, directly attributing their source. This functionality allows you to easily calculate and compare the conversion rates of different sourcing channels.
4. Employee referral rate
Measurement: Number of hires from employee referrals divided by total number of hires, multiplied by 100.
Formula:
Employee referral rate = (Number of hires from employee referrals / Total number of hires) x 100
Example:
- Number of hires from employee referrals: 7
- Total number of hires: 128
- Formula = (7 /128) x 100
- Employee referral rate = 5.47%
Employee referral rate represents the percentage of hires that come from referrals made by existing employees. For example, if you observed that 35% of your hires in a year were from employee referrals, this indicates a strong network and a positive internal perception of your company. By monitoring the employee referral rate, you can weigh the effectiveness of your referral program and understand its impact on your overall recruitment strategy.
5. Time to fill
Measurement: Time between a job opening’s creation to a candidate’s offer acceptance.
Formula:
Time to fill = Date the job opening is created – Date the candidate accepts the job offer
Example:
- Date the job opening was created: May 11, 2024
- Date the candidate accepted the job offer: July 7, 2024
- Formula: July 7, 2024 – May 11, 2024
- Time to fill: 57 days
Time to fill provides a ballpark of how long it typically takes to hire a candidate for a role. Suppose you opened a job as an administrative assistant at your corporate office and have historical data on this position. In that case, it can help you plan and manage your team’s workload and expectations more effectively and ensure that you cover important roles without significant delays.
But how about organizations that lack this historical data? In this case, you can look at external benchmarks. For example, those provided by the Bureau of Labor Statistics can offer valuable insights into average hiring timelines for similar roles and guide your recruitment strategies even without prior internal metrics.
6. Time to hire
Measurement: Time between a candidate’s application and their offer acceptance.
Formula:
Time to hire = Date the candidate accepts the job offer – Date of a candidate’s application
Example:
- Date of the candidate’s application: June 12, 2024
- Date the candidate accepted the job offer: July 7, 2024
- Formula: July 7, 2024 – June 12, 2024
- Time to hire: 25 days
Time to hire gives you insights to your overall recruitment efficiency. In contrast, time to fill reflects the total duration you need to find and onboard the right candidate for a position. For example, your company usually takes six weeks to hire image designers. Upon implementing a new recruitment process, you cut that down to four weeks, which reflects an improvement in your hiring efficiency. With the time to hire historical data, you can identify trends and improve your recruitment strategy.
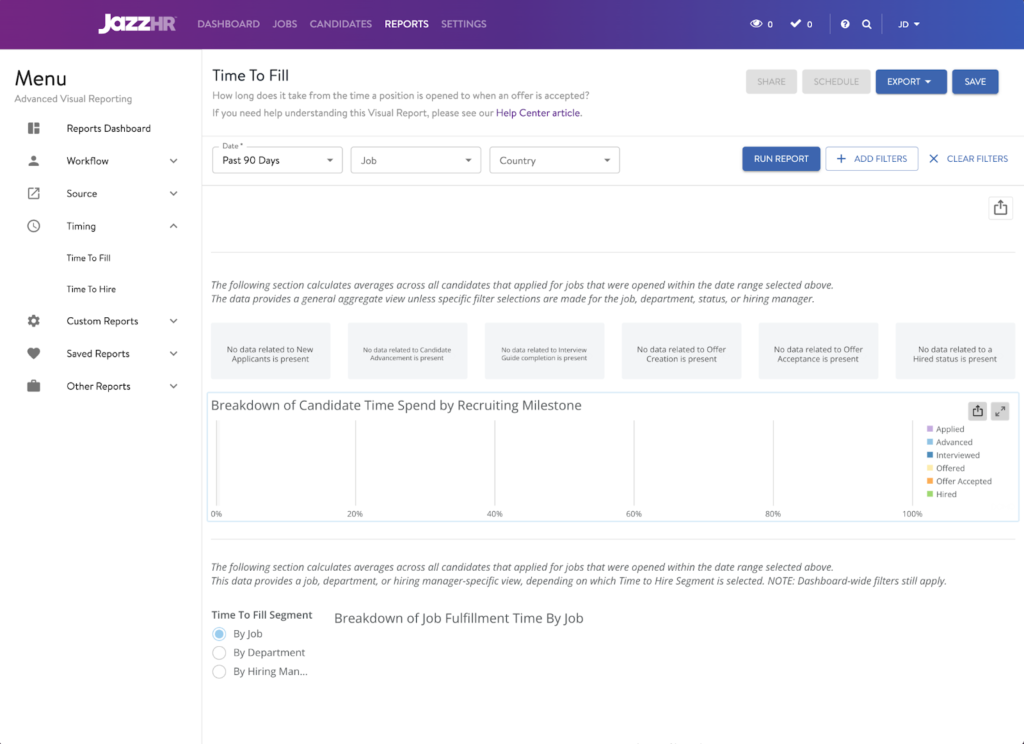
For instance, time to fill and time to hire both measure portions of the time it takes to hire a new employee. Through JazzHR‘s basic reporting features, you can generate time to hire data in a table format. Aside from time to hire, you can also see the average number of days it took for candidates to progress through various stages of the hiring pipeline, such as advanced, interviewed, offered a position, and hired. You can even sort these reports by job, by department, and by hiring manager, so you can have detailed analysis and comparison across different segments of the organization. This granularity helps in specifying bottlenecks to optimize your recruitment strategies.
7. Candidate response time
Measurement: Time elapsed between the company’s outreach to a candidate and the candidate’s reply.
Formula:
Candidate response time = Date the candidate responded – date of company’s outreach
Example:
Date of company’s outreach: June 1, 2024
Date of candidate’s response: June 3, 2024
Formula: June 3, 2024 – June 1, 2024
Candidate response time: 2 days
Candidate response time represents the duration between a company reaching out to a candidate and their reply. For example, if you sent an interview invitation to a candidate on June 1st and received a response on June 3rd, the candidate response time is two days. Knowing the average candidate response time will help you evaluate how effective your communication methods are. It can also reflect candidates’ interest and the quality of your employer brand.
8. Applicants per opening
Measurement: Number of applicants who applied for each position.
Example:
Number of applicants for the administrative assistant position: 44
Number of applicants for the executive assistant position: 16
Number of applicants for the office manager position: 5
Applicants per opening represents the average number of candidates applying for each job vacancy. It illustrates a job opening’s popularity. For example, if a marketing firm advertises a new position and receives 100 applications, the number of applicants per opening for that job is 100. Having this data ready will help you gauge how attractive your job postings are and the strength of your recruitment channels.
9. Application completion rate
Measurement: Number of candidates who completed the job application process divided by the total number of applicants, multiplied by 100.
Formula:
Application completion rate = (Number of candidates who completed the job application process / Total number of applicants) x 100
Example:
Number of job applications started: 116
Number of completed job applications: 88
Formula = (88/116) x 100
Application completion rate = 75.86%
The application completion rate determines the effectiveness of the job application platform or process. For instance, if a company finds that out of 200 applicants who begin the application process, only 100 complete it, the application completion rate would be 50%. This low rate could signal a that you application process is complex or lengthy.
Tracking this metric is important because it helps identify and improve any snags within your pipeline. It maintains optimal applicant experience and prevents the loss of potential talent. Alternatively, many ATS can help simplify the application process.
10. Percentage of open positions
Measurement: Number of open positions divided by the total number of positions in an organization, multiplied by 100.
Formula:
Percentage of open positions = (Number of open positions / Total number of positions in an organization) x 100
Example:
Number of open positions: 15
Total number of positions in an organization: 62
Formula: (15/62) x 100
Percentage of open positions: 24.19%
Percentage of open positions indicates current labor market trends, like supply and demand, for a position. Suppose a popular restaurant chain has 10% of its server positions open during the peak summer season. This figure might mean a broader shortage of available restaurant staff in the area or increased demand due to seasonal tourism.
You should compare this metric to seasonal industry, location, and role data to understand if this is truly a factor. Further, you should also look inward to see if other factors could be the cause (such as poor marketing efforts or poor follow-up with candidates that cause high candidate drop-off rates and lead to more open positions).
Keeping track of your company’s percentage of open positions helps you identify potential staffing issues before they impact your business operations. It allows you to adjust your recruitment efforts and ensure that your staffing levels meet customer demand effectively.
11. Offer acceptance rate
Measurement: Number of offers accepted divided by the number of offers made, multiplied by 100.
Formula:
Offer acceptance rate = (Number of offers accepted / Number of offers made) x 100
Example:
Number of offers accepted: 8
Number of offers made: 10
Formula: (8/10) x 100
Offer acceptance rate = 80%
Offer acceptance rate indicates the attractiveness of a job opening’s benefits and compensation packages, as well as how the candidate perceives your company culture and how pleasant their experience during the hiring process was. For instance, a startup offering a software engineer’s salary that is below industry standards will most likely have a low offer acceptance rate. This situation will negatively affect your company’s ability to attract top talent. Observing your offer acceptance rate will help ensure that your compensation and benefits are competitive and aligned with market expectations.
12. Interview to hire ratio
Measurement: Number of offers made divided by the number of interviews, multiplied by 100.
Formula:
Interview to hire = (Number of offers made / Number of interviews) x 100
Example:
Number of offers made: 12
Number of interviews: 39
Formula: (12/39) x 100
Interview to hire = 30.77%
Interview to hire ratio indicates the effectiveness of recruitment and screening strategies in bringing quality candidates to hire. To illustrate, if a company interviews 50 candidates for a project manager position but only makes one hire, this high ratio may suggest that the screening process needs to be more effective in narrowing down the candidate pool to the best matches. Conversely, a low ratio often means your screening methods are effective and that only the most suitable candidates reach the interview stage.
13. Recruitment funnel effectiveness
Measurement: Number of candidates who completed the stage divided by the number of candidates who entered the stage, multiplied by 100.
Formula:
Recruitment funnel effectiveness = (Number of candidates who completed the stage / Number of candidates who entered the stage) x 100
Example:
Number of candidates who completed the stage: 6
Number of candidates who entered the stage: 26
Formula = (8/26) x 100
Recruitment funnel effectiveness = 23.08%
Recruitment funnel effectiveness gives you yield ratios to estimate how many candidates will progress through each step. Consider a company that observes 100 initial applicants, of which only 10 make it to the final interview stage, and only 3 receive job offers. This scenario demonstrates the funnel’s narrowing at each critical step. That way, you can assess where candidates are being lost or filtered out excessively.
By examining the effectiveness of your recruitment funnel, you can pinpoint areas where improvements are necessary, like enhancing the screening process to better match candidate qualifications with job requirements. For example, a low number of applicants per opening could indicate that you have poor sourcing channels, job unpopularity, or a job description that is too narrow.
Similarly, low application completion rates could mean you have a poor user experience due to an overly complicated application or website design for candidates applying online.
If you have low percentages, you may need to readjust your job descriptions, compensation, or benefits packages to keep a steady stream of candidates and entice them to join your team.
14. Sourcing channel cost
Measurement: Dollar amount spent on a sourcing channel in a specific timeframe divided by the number of successful job applicants from that source in the same timeframe.
Formula:
Sourcing channel cost = Amount spent on a sourcing channel in a specific timeframe / number of hires successful job applicants from that source
Example:
Amount spent on a sourcing channel in a specific timeframe: $314
Number of hires from that source: 5
Formula = ($314/5)
Sourcing channel = $62.8
Sourcing channel cost indicates which channels provide the best candidates for the money. For instance, consider the expenses of sourcing candidates through LinkedIn and a traditional staffing agency. If you spend $500 on a LinkedIn campaign and attract 100 potential candidates, the cost per candidate is $5. In contrast, using a staffing agency might incur a fee of $3000 but yield only 30 candidates, resulting in a cost of $100 per candidate. This direct comparison not only highlights the more cost-effective channel but also influences where to focus future recruitment efforts to maximize budget efficiency. Further analysis into the quality of hires from each source will provide you deeper insights into the overall value of each channel
15. Cost per hire
Measurement: Total internal and external recruitment costs divided by the total number of hires.
Formula:
Cost per hire = (Internal + external recruitment costs) / total number of hires
Example:
Internal recruitment costs: $88
External recruitment costs: $200
Total number of hires: 12
Formula = ($149+284) / 12
Cost per hire = $36.08
To accurately calculate internal recruitment costs, businesses need to consider the time investment from their teams. This includes the time recruiters and hiring managers spend sourcing, screening, and interviewing candidates.
Here are some formulas you can use to compute the internal recruitment costs:
- Time spent by recruiter = Average wages x Hours spent
- Time spent by manager = Average wages x Hours spent
- New hire onboarding time = Average wages x Hours spent
Summing these figures provides a comprehensive view of the total internal recruitment expenses.
External recruitment costs include a broader range of expenditures, such as fees paid for job postings on online job boards, social media campaigns, and other marketing efforts to attract candidates. For example, a small business might spend $300 on job board postings, $200 on a targeted social media ad campaign, and another $500 on participating in a local job fair.
Additionally, some companies may also engage with universities or attend campus recruitment events.These activities involve travel expenses, registration fees, and promotional materials, which can significantly increase the overall recruitment expenditure. Tracking these costs will help you understand the total investment in your recruitment efforts and evaluate their effectiveness in attracting qualified candidates.
16. Quality of hire
Measurement: Varies; typically measured by a new hire’s performance rating.
Example: New hire performance rating: 3.75 (with 5 being the highest and 1 being the lowest score.)
Quality of hire is a metric that evaluates the effectiveness of the hiring process by assessing the value a new employee adds to an organization. It Illustrates your talent acquisition team’s hiring success. Most companies base quality of hire on the new employee’s performance rating.
For example, a software development company hires a new developer who, after six months, receives a performance rating of 3.75 out of 5. While this rating suggests a high-quality hire contributing positively to the company’s goals, remember that such metrics represent more than just the individual’s performance.
The quality of hire is influenced by multiple factors, including role-specific expectations, the extent of training provided, and the individual’s tenure at the company. Therefore, this metric should reflect the hiring process’s effectiveness and the support and development provided by HR, trainers, and managers. Additionally, if the new hire satisfies the role’s key performance indicators (KPIs) and generates revenue for the company exceeding the cost to hire them, they are a net win.
17. Satisfaction scores
Measurement: Varies based on surveying method, like Net Promoter Score (NPS).
Satisfaction scores allow companies to obtain direct feedback on recruitment processes, such as candidate experience, new hire job satisfaction, and hiring manager satisfaction. Its measurement varies based on the surveying method used.
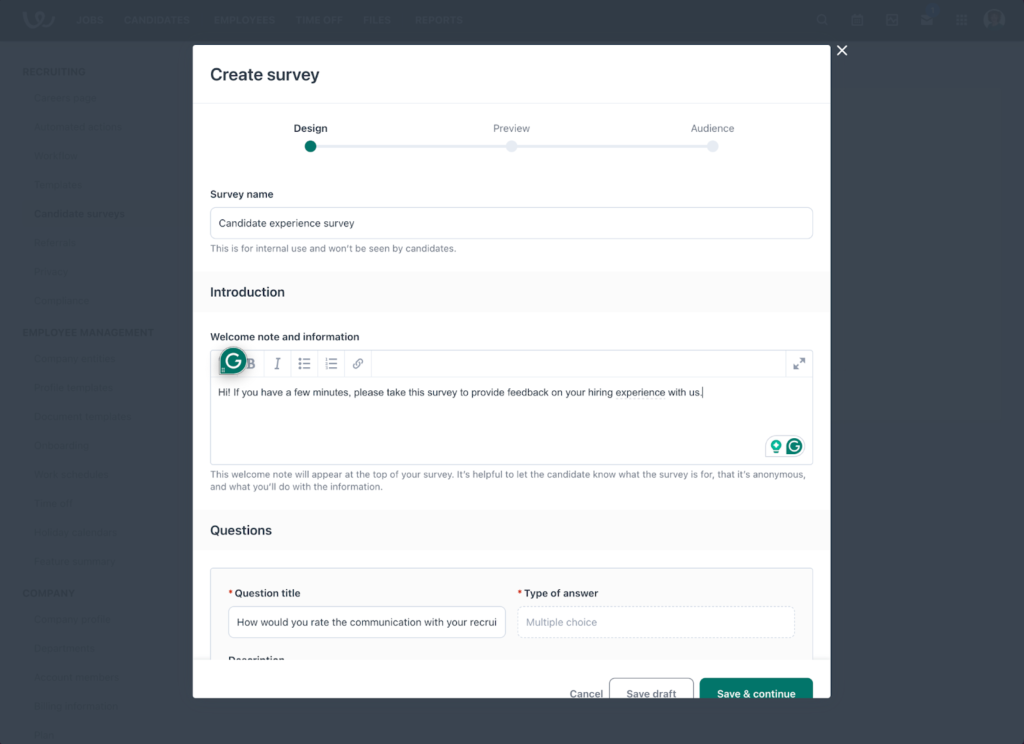
For example, a tech company could send a survey to all new hires three months after their start date. The survey asks about their satisfaction with the recruitment process, including clarity of communication, the efficiency of the interview schedule, and overall onboarding experience. Results from these surveys help you identify strengths and areas for improvement in your recruitment team’s efforts.
Workable can collect and analyze these responses to help reveal the strengths and weaknesses of your hiring process. Over time, this continuous feedback helps refine your approach, improving candidate interactions and overall hiring quality.
18. Candidate demographics
Measurement: Varies based on Equal Employment Opportunity (EEO) data collected from candidates.
Candidate demographics’ measurement varies but typically involves collecting candidates’ Equal Employment Opportunity (EEO) data. For example, you may use a voluntary survey that collects anonymized demographic information such as race, gender, and age from job applicants. This data provides essential insights into the diversity of the candidate pool and the effectiveness of the company’s DEI (Diversity, Equity, and Inclusion) initiatives.
If you gather EEO data, you can use candidate demographics to see your applicants’ diversity throughout the hiring process. You can then take measures to address any hiring biases or market your job openings through sourcing channels to increase applications from diverse groups.
However, according to guidelines from the U.S. Equal Employment Opportunity Commission (EEOC), only private sector employers with 100 or more employees and federal contractors with 50 or more employees are required to collect and report specific EEO data. Employers within these categories must comply with these regulations to ensure accurate reporting and adherence to federal requirements.
Make software do the work for you
When it comes to monitoring sourcing metrics, I find that SMB-focused recruitment software falls short in its reporting and analytics capabilities. They have standard pre-configured reports that cover different types of recruitment metrics.
Most of the top recruiting tools today automatically track and calculate recruitment metrics; some even provide companies with customizable reports and visualizations to make drawing meaningful conclusions easier.
In addition, recruitment tools can:
- Compare recruitment benchmarks for job openings in similar industries and locations.
- Save historical company recruitment data to create company-specific criteria.
- Streamline hiring processes to improve overall efficiency.
You can also integrate recruitment data with other HR software, such as all-in-one HR suites, onboarding, offboarding, and performance management solutions, to track additional workforce analytics like retention, turnover, and attrition rates. In other words, businesses that take full advantage of their entire HR tech stack can improve their recruitment processes and outpace their competitors in the race for the best new hires.
Check out our Recruitment Software and Applicant Tracking Systems (ATS) Guides for solutions to start tracking your recruitment metrics.