What is business intelligence software?
Business intelligence (BI) software is any application that collects and processes large amounts of unstructured data from internal and external systems and prepares data for analysis. The software is generally used for querying and reporting complex business data. The ultimate goal of BI software is to drive better business decisions, increase revenue, improve operational efficiency, and gain competitive advantages.
Business intelligence tools gather data from various sources, such as databases, spreadsheets, and other business applications, and transform it into an understandable format for analysis. The software performs tasks such as data mining, forecasting, and reporting, as well as visualizing data through charts and graphs, allowing users to identify data trends and patterns. BI software also comes with reporting capabilities so users can create custom reports and presentations shareable with stakeholders.
Check out my pics for the top business intelligence software below.
- Tableau: Best for data visualization
- Sisense: Best for embedded analytics
- Qlik Sense: Best mobile BI software
- Zoho Analytics: Best self-service BI software
- IBM Cognos Analytics: Best for reporting
Featured partnersFeatured Partners
My top picks for business intelligence software

Tableau: Best for data visualization
Overall Score
4.3/5
Pros
- Quick, attractive data visualization
- Drag-and-drop interface good for beginners
- Real-time data reflection
- Tableau Pulse AI insights
- Extensive integration capabilities
Cons
- Can be expensive
- Experience needed to fully leverage capabilities
- Slow data loading reported
Why I picked Tableau
Tableau’s data visualization capabilities and easy-to-use interface have always been this software’s greatest strengths.
With the recent 2024.3 update, I’m seeing Tableau reinforce its position as a top player in the analytics space. The update introduces Tableau Cloud Manager, which allows me to manage licenses centrally without needing to license each user individually. This is a significant time-saver for enterprise clients, especially with data governance requirements. New features like the table viz extension, spatial parameters, and integration with Microsoft Teams further streamline Tableau’s usability.
The ‘Embedding Playground’ is a nice addition, giving greater flexibility and creativity when embedding analytics—something I haven’t found in other BI tools like Microsoft Power BI or Qlik. I also appreciate the new ‘Custom Data Labels,’ which improve data management with advanced categorization and discovery options that stand out compared to competitors.
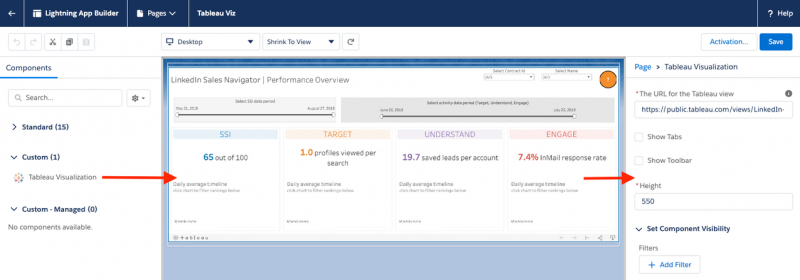
Tableau’s ‘Dynamic Axis Ranges’ bring impressive customization to visualizations, allowing me to adapt views to different datasets with ease—a level of flexibility that many other platforms don’t match. Integration with Salesforce through the ‘Native Lightning Web Component for Tableau’ and the ‘Tableau Cloud add-on for Google Workspace’ enhances the analytics experience across platforms. This level of seamless integration is particularly valuable, especially when compared to Power BI, which, while strong within Microsoft’s ecosystem, may not offer the same flexibility across different platforms.
The software’s focus on enhancing user experience and customization, coupled with strategic integrations, positions it as a comprehensive tool for data-driven decision-making. In comparison to its key competitors, Tableau offers a unique combination of versatility, innovation, and user-centric design, making it an strong asset in any data-driven organization’s toolkit.
Also read: Top Tableau Alternatives For Visualizing & Analyzing Data
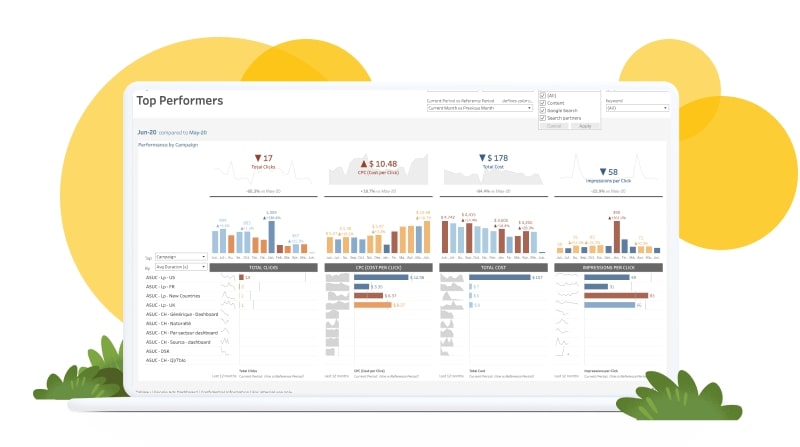
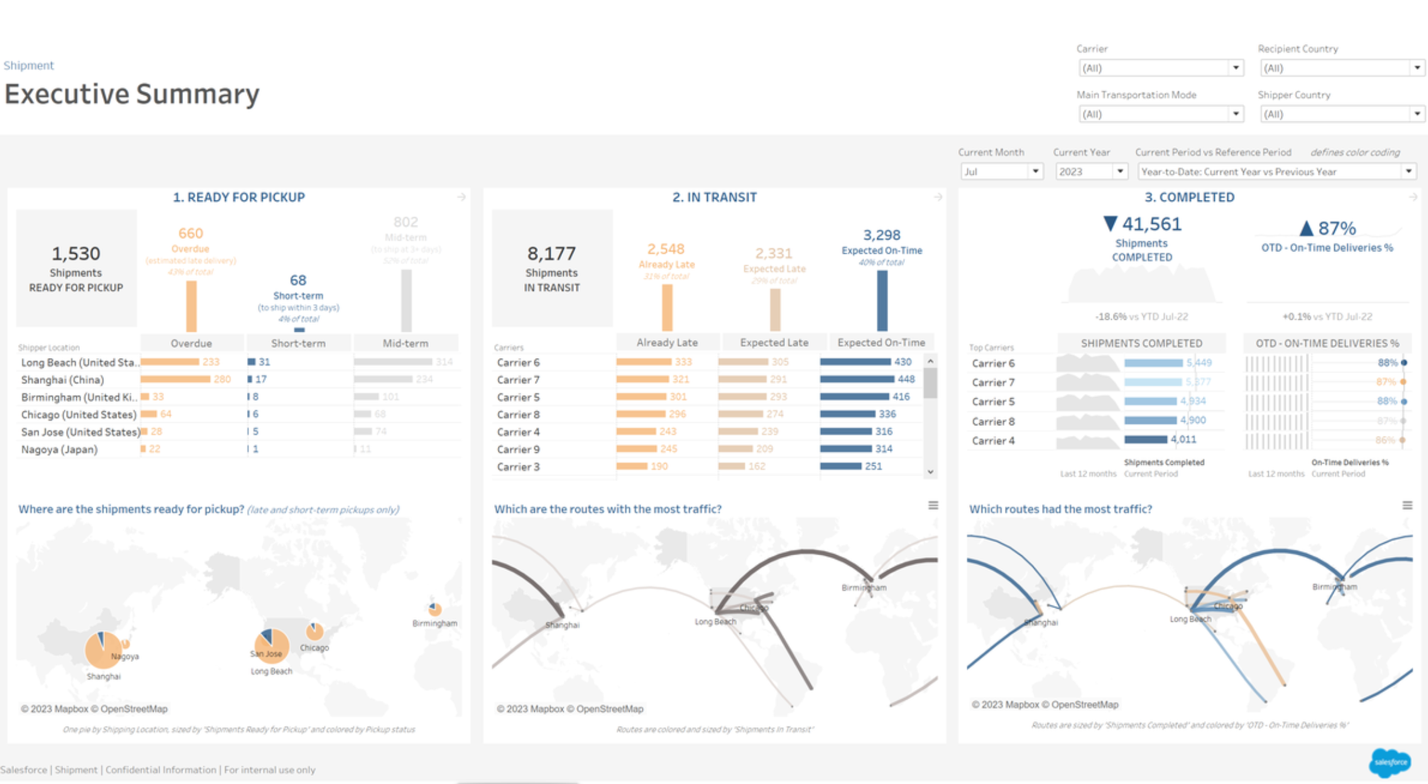
Tableau, a leading data visualization BI tool, is designed to help businesses turn raw data into actionable insights. Its standout features include an intuitive drag-and-drop interface, real-time data analytics, and interactive dashboards that empower users to explore data in a user-friendly environment. Tableau’s Data Blending and Cross-Database Joins enable the combination of data from multiple sources, and its Tableau Public allows the sharing of data visualizations to a wider audience.
Users can present data in the form of charts, graphs, and other visual representations with dashboards and visualization tools. It also allows users to identify trends and patterns in data and make more informed decisions.
Tableau Public: This proprietary feature allows users to publish their data visualizations to the public, providing a platform for sharing and collaboration. It promotes transparency and broadens the reach of your insights, making data storytelling accessible to a wide audience.
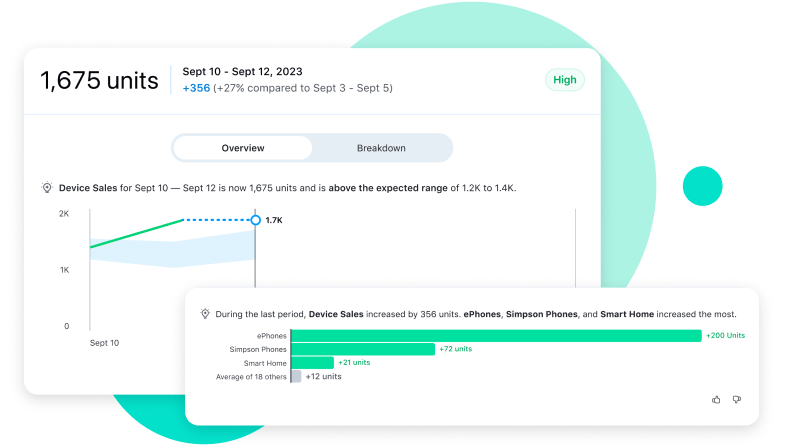
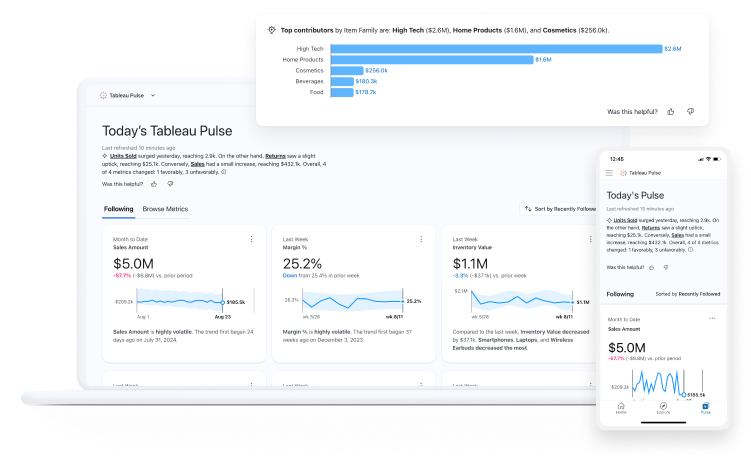
Tableau Pulse AI Insights: This system allows for AI insights garnered from your data appearing throughout the Tableau system. Being tied to Salesforce, a leader in AI among B2B software vendors, has undoubtedly benefited Tableau as it brings forward its own AI tools.
Data Blending: Data blending allows users to combine data from multiple sources without the need for complex data warehouse solutions. This feature simplifies the process of analyzing disparate data, providing a comprehensive view of insights.
Hyper Engine: Tableau’s Hyper Engine is a high-performance in-memory data engine technology that helps businesses analyze large datasets at impressive speed. This feature ensures efficient data exploration and rapid extraction of insights, enhancing the overall user experience.
Mobile Optimized: Tableau offers robust mobile support, allowing users to access, interact with, and explore their data visualizations on mobile devices. The platform provides a seamless experience across desktop and mobile, enabling decision-makers to access insights anywhere and anytime.
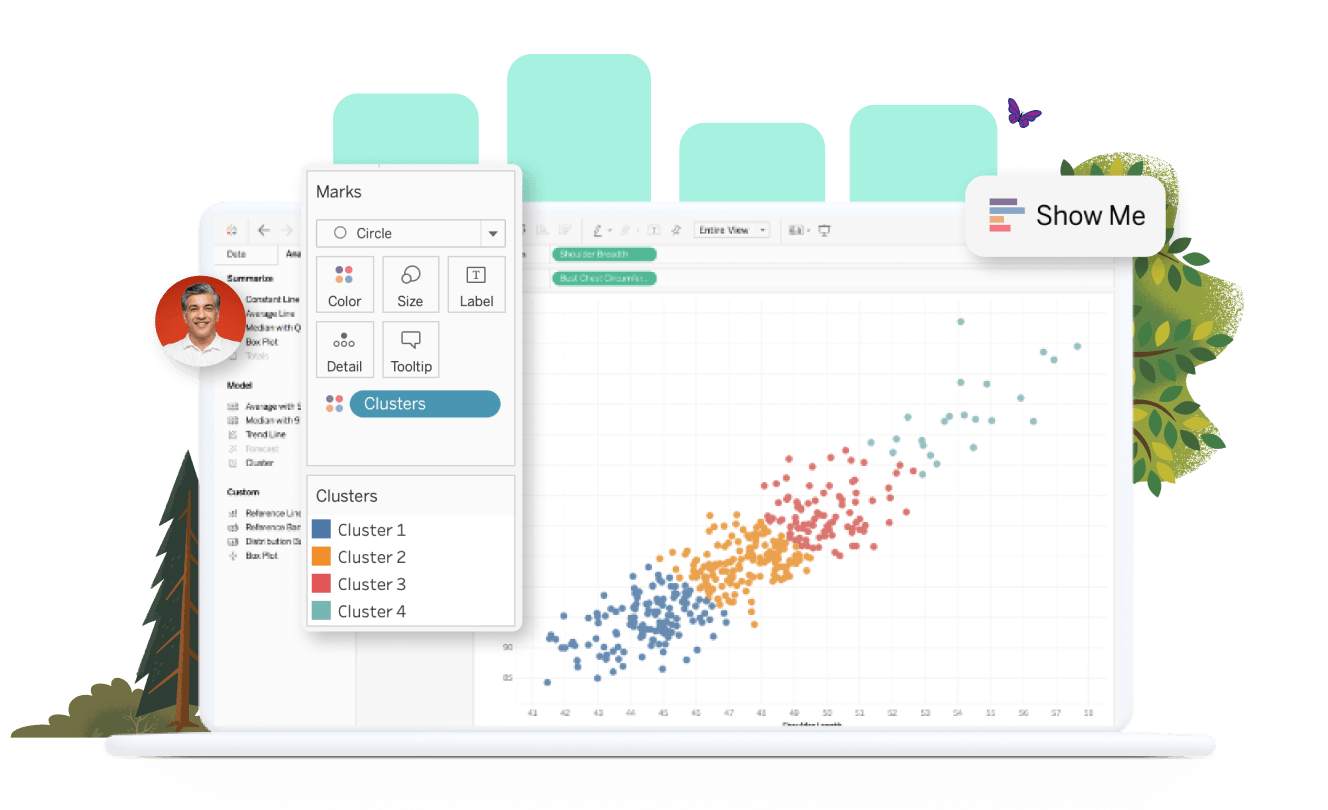
Advanced Analytics: Tableau includes advanced analytics capabilities, such as predictive modeling and statistical analysis. Users can leverage these tools to delve deeper into their data, identify trends, and make predictions based on historical data, enhancing strategic decision-making.
Extensive Customization Options: Tableau allows extensive customization of dashboards and reports with its powerful scripting capabilities using Tableau’s Calculation Language. Users can manipulate data, customize visualizations, and fine-tune analytics to meet specific business requirements, enabling precise and meaningful data representation.
Free trial available
Free version available
Tableau Viewer: $15/user/month
Tableau Explorer: $40/user/month
Tableau Creator: $70/user/month
Pricing: 4.2/5
General features and interface: 4.3/5
Core features: 5/5
Advanced features: 4.5/5
Integration and compatibility: 4.7/5
UX: 3.6/5

Sisense: Best for embedded analytics
Overall Score
4.1/5
Pros
- Embedded analytics
- AI-powered Ask Data feature
- In-Chip technology
- Good customer support
- Handles large datasets well
Cons
- Learning curve
- Resource intensive
Why I picked Sisense
Sisense’s recent updates and features, particularly in embedded analytics, make it a compelling choice for businesses seeking a BI solution that offers deep integration capabilities, efficient data handling, and user-friendly interfaces. Unlike Power BI, Sisense provides distinct advantages in embedded analytics and data manipulation, although it may require stronger IT support for implementation and advanced analytics setup.
In Sisense’s 2024.3 update, I found several enhancements that make it stand out as an embedded analytics solution. The new AI-powered “Ask Data” feature allows me to interact with data using natural language, instantly generating visualizations and making data exploration incredibly intuitive. The improved dashboard customization options also let me tailor views to specific needs, offering a flexible and personalized experience. Additionally, the expanded data connectivity means I can seamlessly pull data from more sources, which simplifies integrations. With faster load times and enhanced security measures, Sisense has proven to be both powerful and secure, making it an ideal choice for our analytics needs.
In a head-to-head comparison with Microsoft Power BI, Sisense stands out for its ability to “infuse analytics everywhere”, including within customer and employee applications and workflows. While both platforms offer robust data visualization and AI analytics, Sisense’s Elasticube technology is notable for its fast query returns on large datasets. In my opinion, that’s a critical feature for businesses handling vast amounts of data. Power BI, deeply integrated with the Microsoft ecosystem, offers familiarity for Microsoft users but might require additional learning for others.
Sisense also fares well in its data integration capabilities, offering over 100 data connectors. While Power BI surpasses this with over 500 connectors, Sisense’s Elasticube technology compensates by enabling efficient manipulation of diverse data sources. Sisense’s drag-and-drop interface and interactive visualizations provide an easy-to-use platform for building custom BI dashboards, a feature well-received by its users.
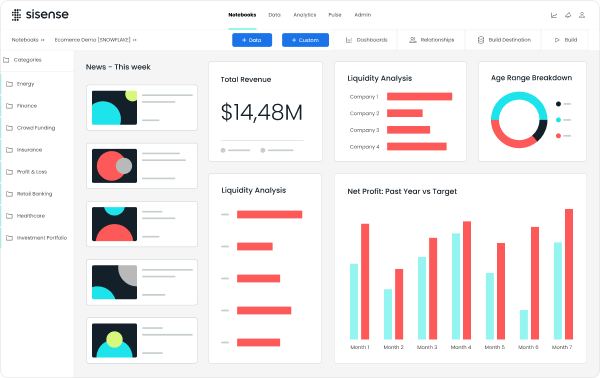
The software’s ‘Fusion Embed’ solution is designed specifically for building white-labeled analytic experiences in apps, a testament to its strong embedded analytics capabilities. This feature, along with Sisense’s scalability and customization options with minimal coding, makes it an ideal choice for businesses looking to integrate analytics seamlessly into their products or services.
Embedded analytics tools use advanced algorithms to analyze large volumes of data and recognize trends and patterns that may not be immediately apparent. With data mining, predictive analytics, and prescriptive analytics, organizations can make decisions based on historical data.
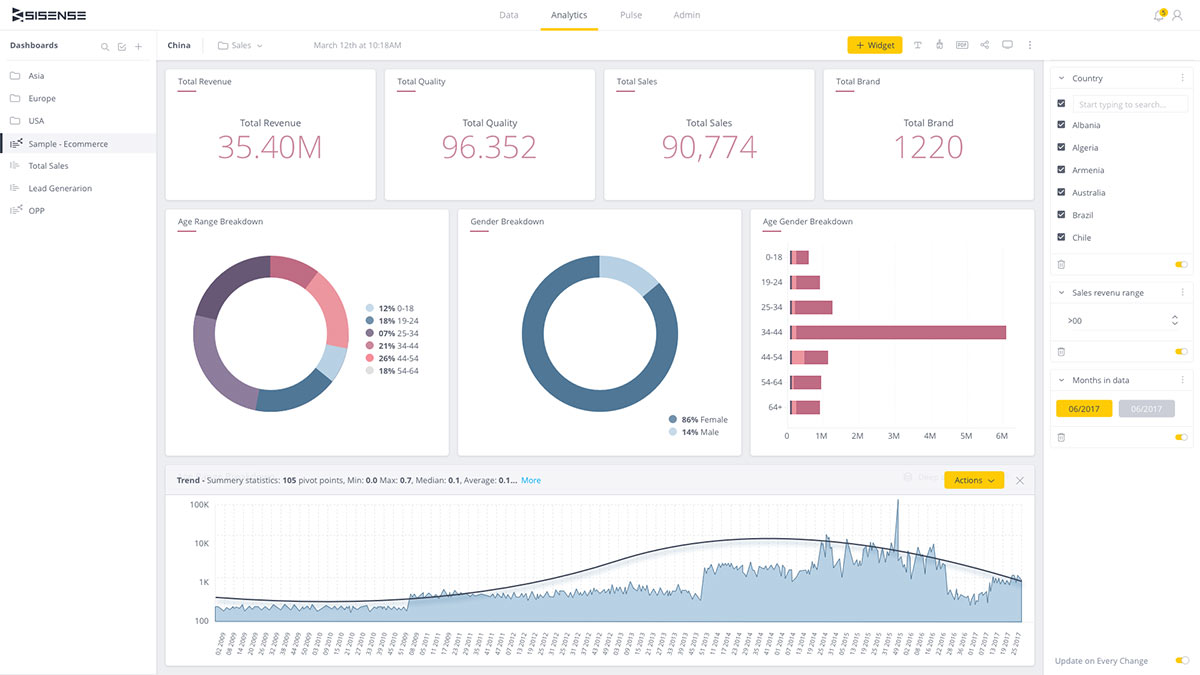
Sisense is a Business Intelligent platform designed to simplify complex data processes. Its embedded analytics capabilities offer seamless integration into existing business applications.
The platform’s Elasticube technology handles large datasets, and its proprietary In-Chip technology enables speedy data processing. Its single-stack system facilitates end-to-end data management from extraction to visualization.
ElastiCube Technology: ElastiCube is Sisense’s unique data architecture that allows for efficient handling of large and complex datasets. It provides high-speed, flexible data modeling capabilities that empower businesses to explore and manipulate data with ease.
In-Chip™ Technology: Sisense’s proprietary In-Chip™ technology optimizes the use of computer resources to accelerate data processing speeds, outperforming traditional in-memory solutions. This allows for quicker response times, even on complex queries over large datasets.
Drag-and-Drop Interface: The user-friendly drag-and-drop interface of Sisense enables users to easily create and customize dashboards and reports without needing extensive technical skills. This simplifies the analytics process, making it accessible to users at all levels of technical proficiency.
AI-Powered Ask Data: Sisense’s “Ask Data” feature leverages AI to transform how users interact with data by allowing natural language queries. Instead of writing complex code or navigating multiple filters, users simply type their questions and instantly receive data visualizations and insights tailored to their needs. This intuitive, conversational approach enables faster data exploration and reduces the technical barriers, making it easier for both technical and non-technical users to gain meaningful insights and make data-driven decisions quickly.
Embedded Analytics: Sisense offers robust embedded analytics capabilities that allow businesses to integrate powerful analytics directly into their applications, products, or web portals. This seamless integration helps in delivering interactive analytics to users without them having to leave their operational applications.
Wide Range of Data Connectors: Sisense provides a wide range of data connectors that facilitate easy and quick integration with various data sources, including cloud-based services, databases, and file formats. This enhances the flexibility and scalability of data handling and integration.
Collaborative Analytics: With features designed for collaboration, Sisense enables teams to share insights and make collective decisions based on real-time data. Interactive dashboards can be shared and commented on across the organization, enhancing communication and decision-making processes.
Mobile Responsiveness: Sisense mobile responsive design ensures that users can access and interact with their dashboards and reports from any device, anytime and anywhere. This enhances the flexibility and accessibility of business intelligence insights.


Free trial available
Starting at $25,000/year
Contact Sisense for a custom quote based on your business needs
Pricing: 3/5
General features and interface: 4.3/5
Core features: 5/5
Advanced features: 4.5/5
Integration and compatibility: 4/5
UX: 3.8/5

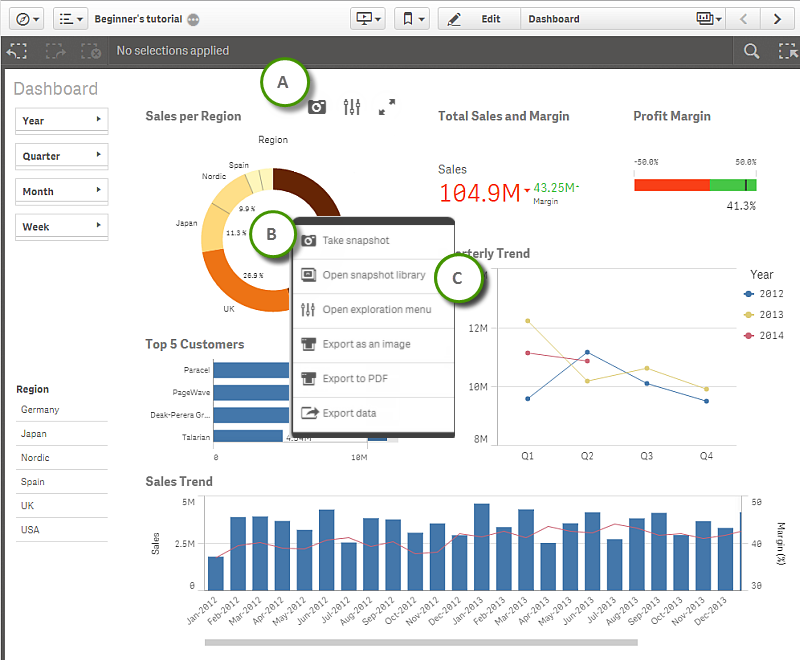
Qlik Sense: Best mobile BI software
Overall Score
4.0/5
Pros
- Lower entry price
- Powerful visualization tools
- Associative data model
- Self-service analytics
- Quality Mobile BI
Cons
- Slower with larger data sets
- Extra cost for add-ons
Why I picked Qlik Sense
One of the key upgrades includes the introduction of a flexible text object in the Dashboard bundle, allowing advanced styling of text, the addition of measures, and the incorporation of tables. This flexibility is vital for mobile users who need to tailor their dashboards on-the-go. Additionally, the Natural Language Insights object has been updated for better functionality and insights, with native support for all Qlik Cloud features. This enhancement significantly boosts data literacy, a crucial aspect for mobile users who often require quick and comprehensible data insights.
The updates also encompass improved font handling, ensuring consistent rendering across devices, which is critical for mobile interfaces, and a new line object that adds customization and detail to sheets, enhancing the mobile user experience. Moreover, the introduction of complex calculations in data tables and the ability to download images for straight table visualization in the Nebula-based straight table are particularly beneficial for mobile users who work with large datasets and require efficient data manipulation and reporting capabilities.
In comparison to its major competitors, Microsoft Power BI and Tableau, Qlik Sense holds its ground well. While Power BI is lauded for its integration with Microsoft solutions and dynamic report creation, it faces challenges with user accessibility and training. Similarly, Tableau, known for its powerful data visualization and flexibility, struggles with functionality and user-friendliness. In contrast, Qlik Sense’s recent enhancements, particularly in mobile capabilities such as responsive design, a mobile application, and interactive dashboards, provide it with a competitive edge.
When considering Qlik Sense’s comprehensive updates and its standing against Power BI and Tableau, it’s evident that Qlik Sense offers a well-rounded and increasingly user-friendly experience for mobile users.
As the name suggests, mobile BI software lets users access and analyze data on mobile devices such as smartphones and tablets. This type of business intelligence software can be particularly useful for sales teams and field workers.
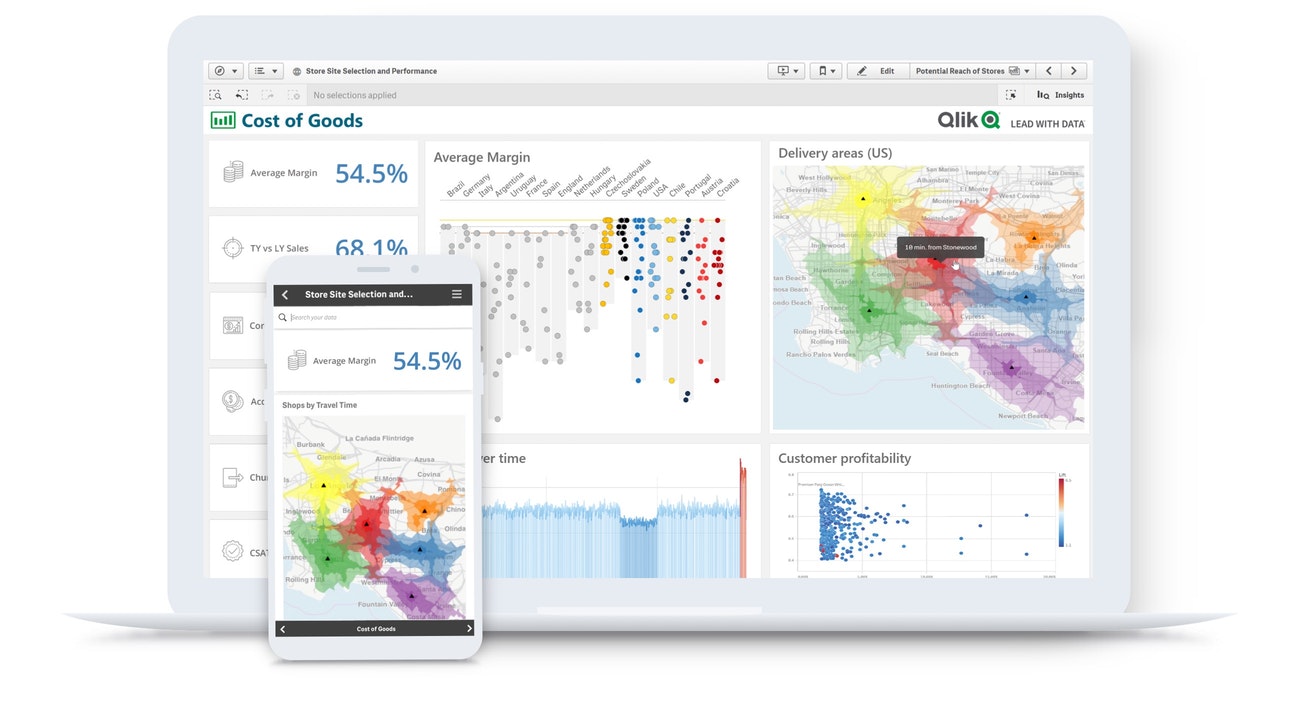
Qlik Sense, formerly QlikView, is a BI platform offering associative data analytics, enabling businesses to uncover hidden data trends and patterns. It’s powered by Qlik’s unique Associative Engine, delivering dynamic, click-driven dashboards and guided analytics applications. A standout feature is its “alternate states” function, facilitating comparative analysis of multiple datasets within a single view. Qlik Sense is particularly adept in offering a fully interactive mobile BI experience, enabling users to explore data, generate insights, and collaborate on-the-go with optimized apps for both tablets and smartphones.
Associative Engine: Qlik Sense’s unique Associative Engine dynamically calculates analytics and highlights data relationships, enabling users to explore data freely without being limited by pre-aggregated data or predefined queries.
Guided Analytics: With Qlik Sense’s guided analytics applications and dashboards, users can drill down data for in-depth analysis, facilitating informed decision-making. This feature provides a structured application or dashboard layout for specific data exploration tasks.
Self-Service Visualization: Qlik Sense enables self-service data visualization, allowing users to easily create and modify visualizations with a drag-and-drop interface. This empowers users at all levels of an organization to generate personalized reports and dynamic dashboards based on their specific needs.
Data Integration: Qlik Sense offers robust data integration capabilities that enable seamless blending of data from multiple sources, including cloud-based and on-premise systems. This feature supports real-time data updates and ensures that users have access to the most current data.
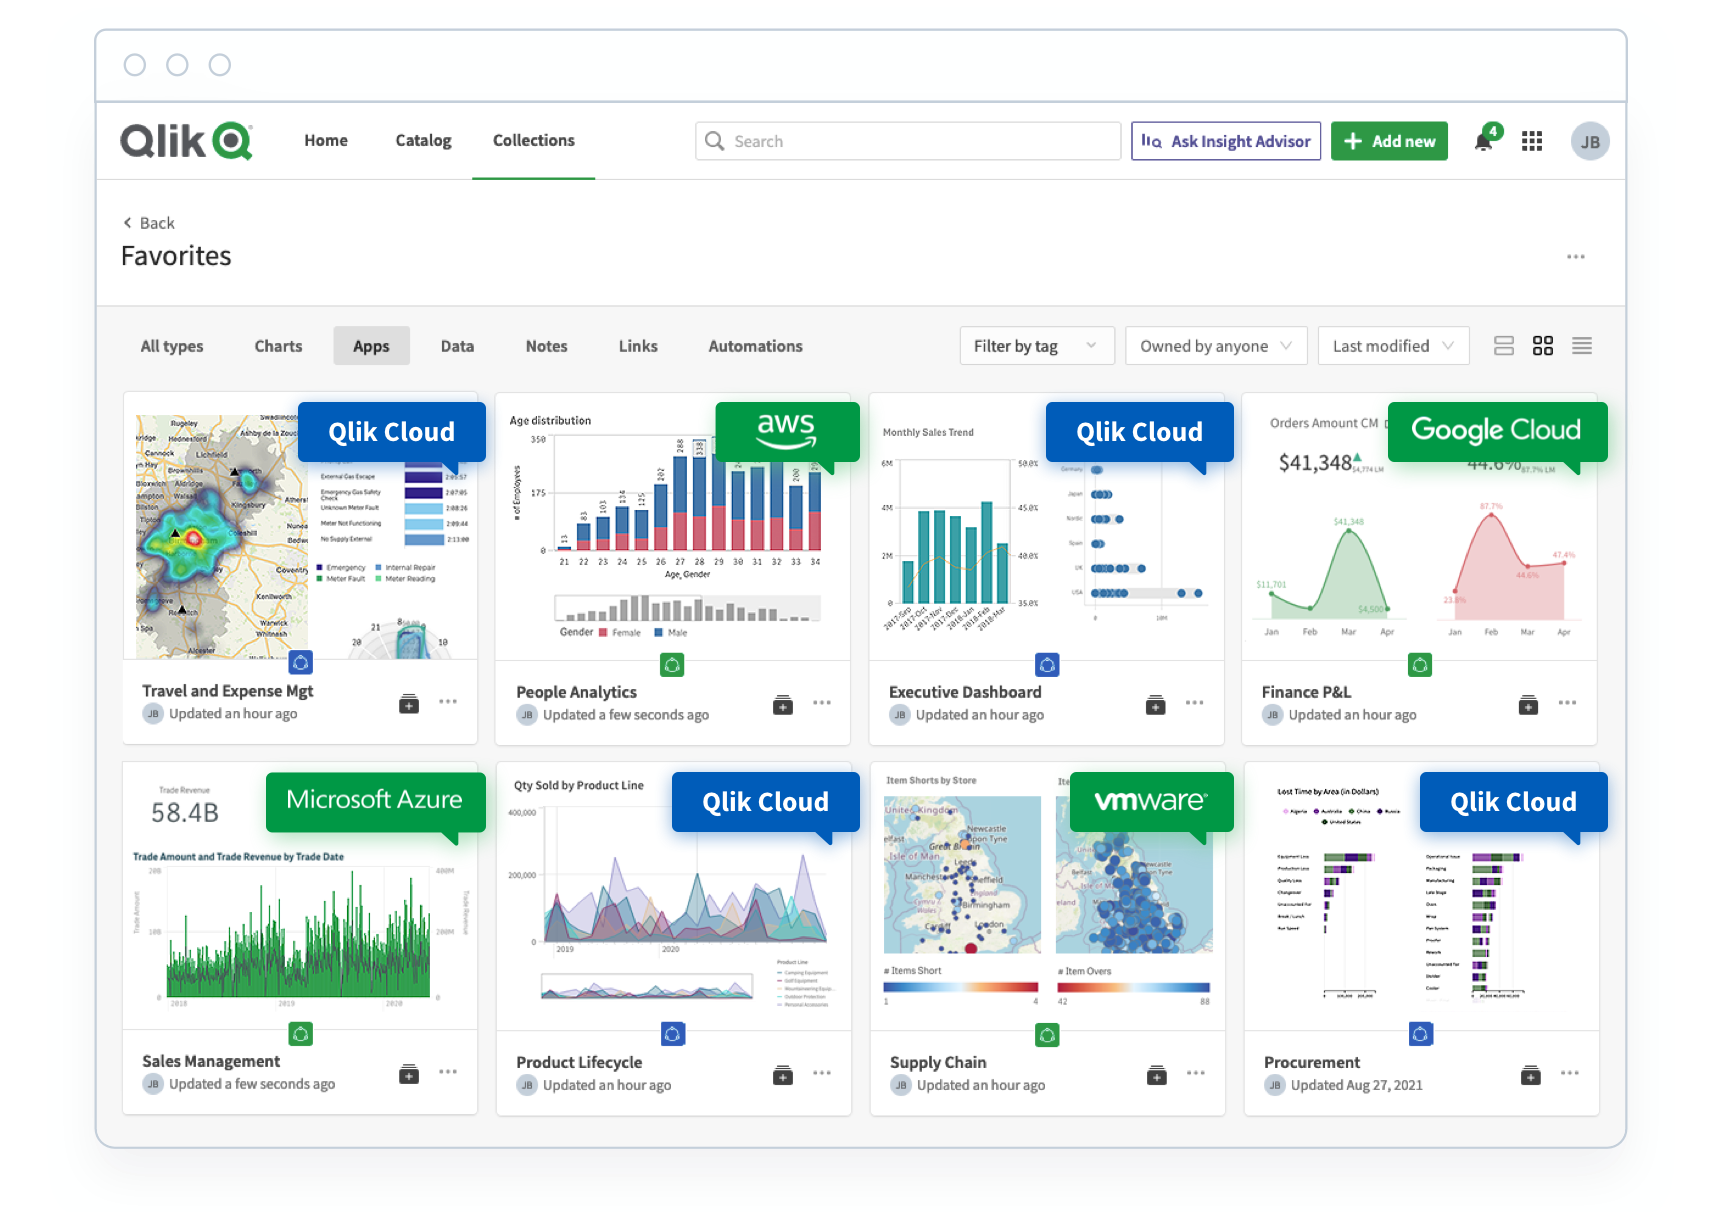
Scalable Infrastructure: Qlik Sense is built on a scalable, multi-cloud architecture that supports a wide range of deployment options, from fully on-premise to fully cloud or a combination of both. This flexibility allows organizations to scale their BI solutions as needed to meet growing demands.
Advanced Analytics Integration: Qlik Sense integrates with external advanced analytics engines, like R and Python scripts, which allows users to perform sophisticated data analysis and extend their analytics with predictive and prescriptive capabilities.
Mobile Responsiveness: Qlik Sense is designed to be fully responsive, making its dashboards and applications accessible on any device without compromising on functionality or user experience. This enables decision-makers to access insights on-the-go.
Data Security: Qlik Sense provides robust data security features, including granular control over data access and governance tools that ensure data integrity and compliance with industry standards and regulations.


Free trial available
Qlik Sense Business: $30/user/month
Enterprise SaaS: Contact Qlikview for a custom quote based on your business needs
Pricing: 3/5
General features and interface: 3.9/5
Core features: 4.8/5
Advanced features: 4.3/5
Integration and compatibility: 4/5
UX: 3.5/5

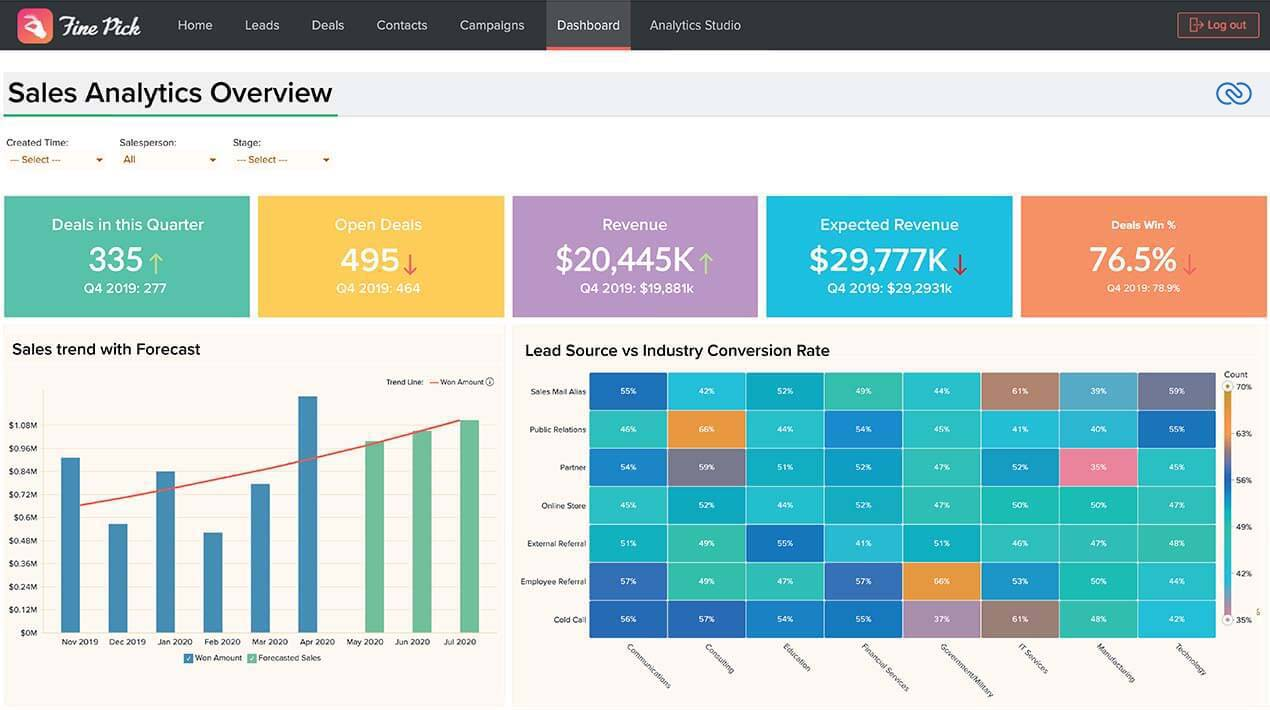
Zoho Analytics: Best self-service BI software
Overall Score
4.0/5
Pros
- Generative AI-Infused BI
- Top-notch collaboration tools
- Advanced analytics
- Scalability
- Competitive pricing
Cons
- Bit of a learning curve
- Inconsistencies in reporting
Why I picked Zoho Analytics
Zoho Analytics makes it easy for non-technical users to analyze complex data and create insightful reports without needing assistance from IT or data experts.
The platform’s AI assistant, Zia, allows users to ask data-related questions in natural language, making data analysis more accessible. In my opinion, it’s one of the betters assistants available right now within BI applications. Its capabilities alongside their Generative AI-Infused BI approach and a constantly improving platform, make it one of my favorite choices.
Additionally, features like data blending, smart data alerts, and the ability to merge data from various sources further enhance its self-service functionality, making it an excellent choice for businesses looking for a comprehensive, easy-to-use BI solution. It’s not the most simple, but I’d argue it’s a good substitution for someone who considers a Sisense or IBM option to be a bit too daunting.
In a September 2024 product update, Zoho Analytics added a variety of new features including unified metrics to eliminate duplication, audit and sync history for data import, and multi-server architecture. The latter will allow for better load distribution, and addresses past user concerns surrounding struggles with larger data sets.
Zoho Analytics has recently enhanced its capabilities with Advanced Analytics for Jotform, allowing deeper insights into audience preferences and engagement. The integration of the “Notes” modules from multiple CRM modules in the Advanced Analytics Connector for Zoho CRM is a significant upgrade, offering users richer customer interaction insights.
Self-service business intelligence tools help businesses authorize employees to access and analyze data even without technical expertise. They enable users to generate reports, run queries, and create visualizations without relying on IT departments.
Zoho Analytics is a self-service business intelligence platform and data analytics software that allows users to create visualizations and data-driven insights without requiring extensive technical knowledge. With its drag-and-drop interface, users can design and share interactive dashboards, reports, and charts.
Zoho Analytics also features AI-driven data alerts, predictive business analytics software, and natural language processing capabilities, which enable users to interact with their data in an intuitive manner. Its integration with various data sources and Zoho’s suite of business applications makes it a comprehensive tool for diverse data analysis needs.
Generative AI-infused BI: This allows users to generate insights and create visualizations through conversational interactions, simplifying data analysis with natural language processing. This feature enables users to instantly generate dashboards, summaries, and trend analyses without requiring technical expertise, making complex data exploration accessible to a broader range of users.
Augmented Analytics: Zoho Analytics leverages artificial intelligence, machine learning, and natural language processing to provide powerful augmented analytics. This enables users to gain deeper insights through automated data preparation, cognitive forecasting, and anomaly detection.
Drag-and-Drop Interface: Zoho Analytics offers a user-friendly drag-and-drop interface that allows users to create and customize dashboards and reports easily. This feature facilitates a seamless experience for users with varying degrees of technical expertise.
Data Integration: Zoho Analytics provides extensive data integration capabilities, enabling seamless connection and synchronization with various data sources, including files, feeds, databases, cloud drives, and popular business applications. This ensures comprehensive data analysis capabilities across diverse datasets.
Collaborative Analytics: The platform features strong collaborative tools that allow teams to share and work on reports and dashboards collectively. Users can comment, share insights, and make informed decisions in a collaborative environment.
Embedded BI: Zoho Analytics offers robust embedded BI capabilities, allowing businesses to embed analytics content into applications, portals, and websites. This integration delivers real-time reporting and dashboards directly within business applications, enhancing operational efficiency.
Multi-tenant Support: Designed for both direct business users and ISVs and SaaS providers, Zoho Analytics includes multi-tenant support as part of its architecture. This enables providers to deliver tailored analytics services to their customers in a secure and scalable manner.
Mobile App: Zoho Analytics has a mobile app that provides access to reports and dashboards on Android and iOS devices, ensuring that users have access to critical business insights anytime, anywhere.
Query Tables: This feature allows users to create powerful custom queries using SQL (Structured Query Language) to manipulate data directly within the platform. This is particularly beneficial for users who need to perform complex data transformations and analyses.


Free trial available
Basic: $24/2 users/month
Standard: $48/5 users/month
Premium: $115/15 users/month
Enterprise: $455/50 users/month
Pricing: 3.8/5
General features and interface: 3.6/5
Core features: 4.2/5
Advanced features: 4.3/5
Integrations and compatibility: 4/5
UX: 3.5/5
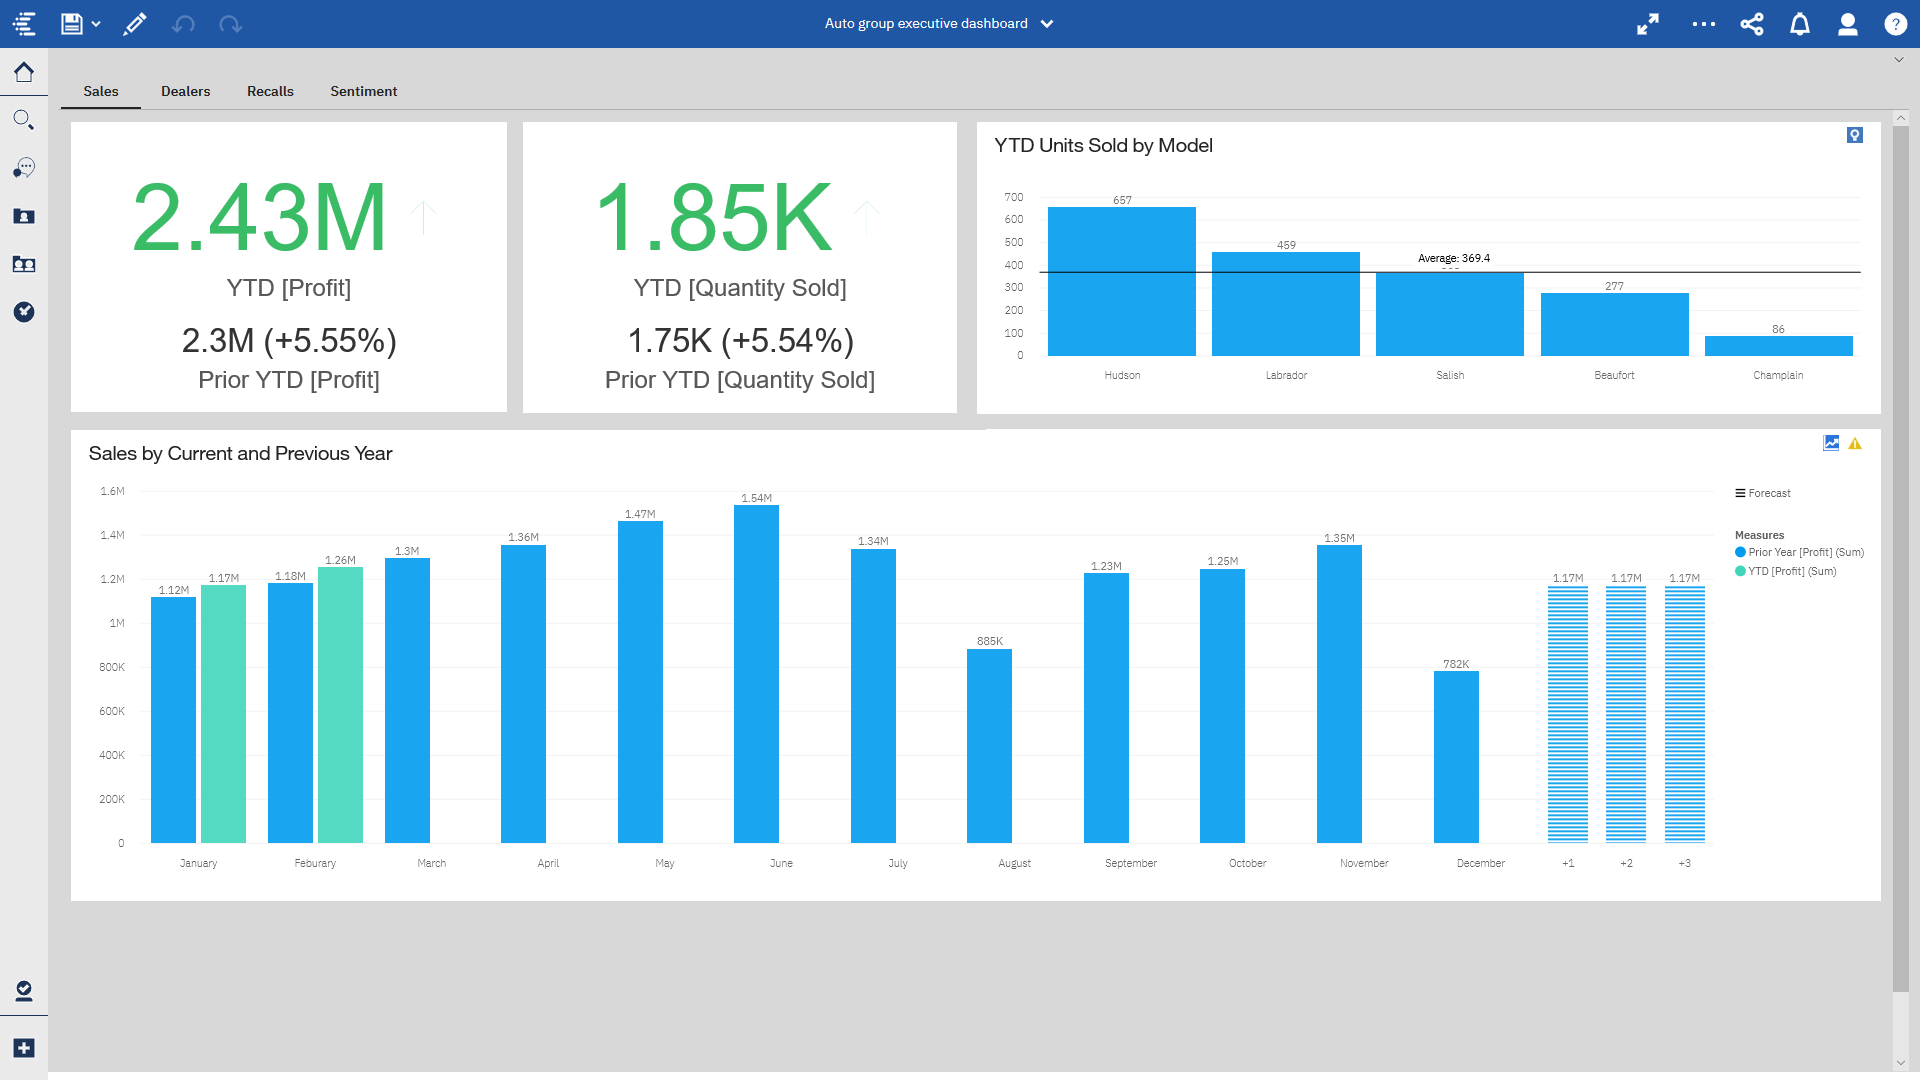
IBM Cognos Analytics: Best for reporting
Overall Score
4.0/5
Pros
- Full-featured BI suite
- Effective dashboards and reports
- AI-enabled exploration
- Top-notch customer support
Cons
- Complexity of use
- Expensive compared to competitors
Why I picked IBM Cognos Analytics
IBM Cognos Analytics offers a powerful AI Assistant that simplifies data querying through natural language processing, enabling users to easily retrieve information and discover data patterns.
A key strength of Cognos Analytics is its self-service capabilities, which are emphasized through features such as AI-assisted data arrangement and automated dashboards. These tools empower users to build their own reports and scorecards in an intuitive manner, facilitating both basic and advanced data analysis. The platform’s AI assistant enhances this experience by allowing users to ask questions in natural language and receive suggested visualizations, making it accessible to users of varying skill levels.
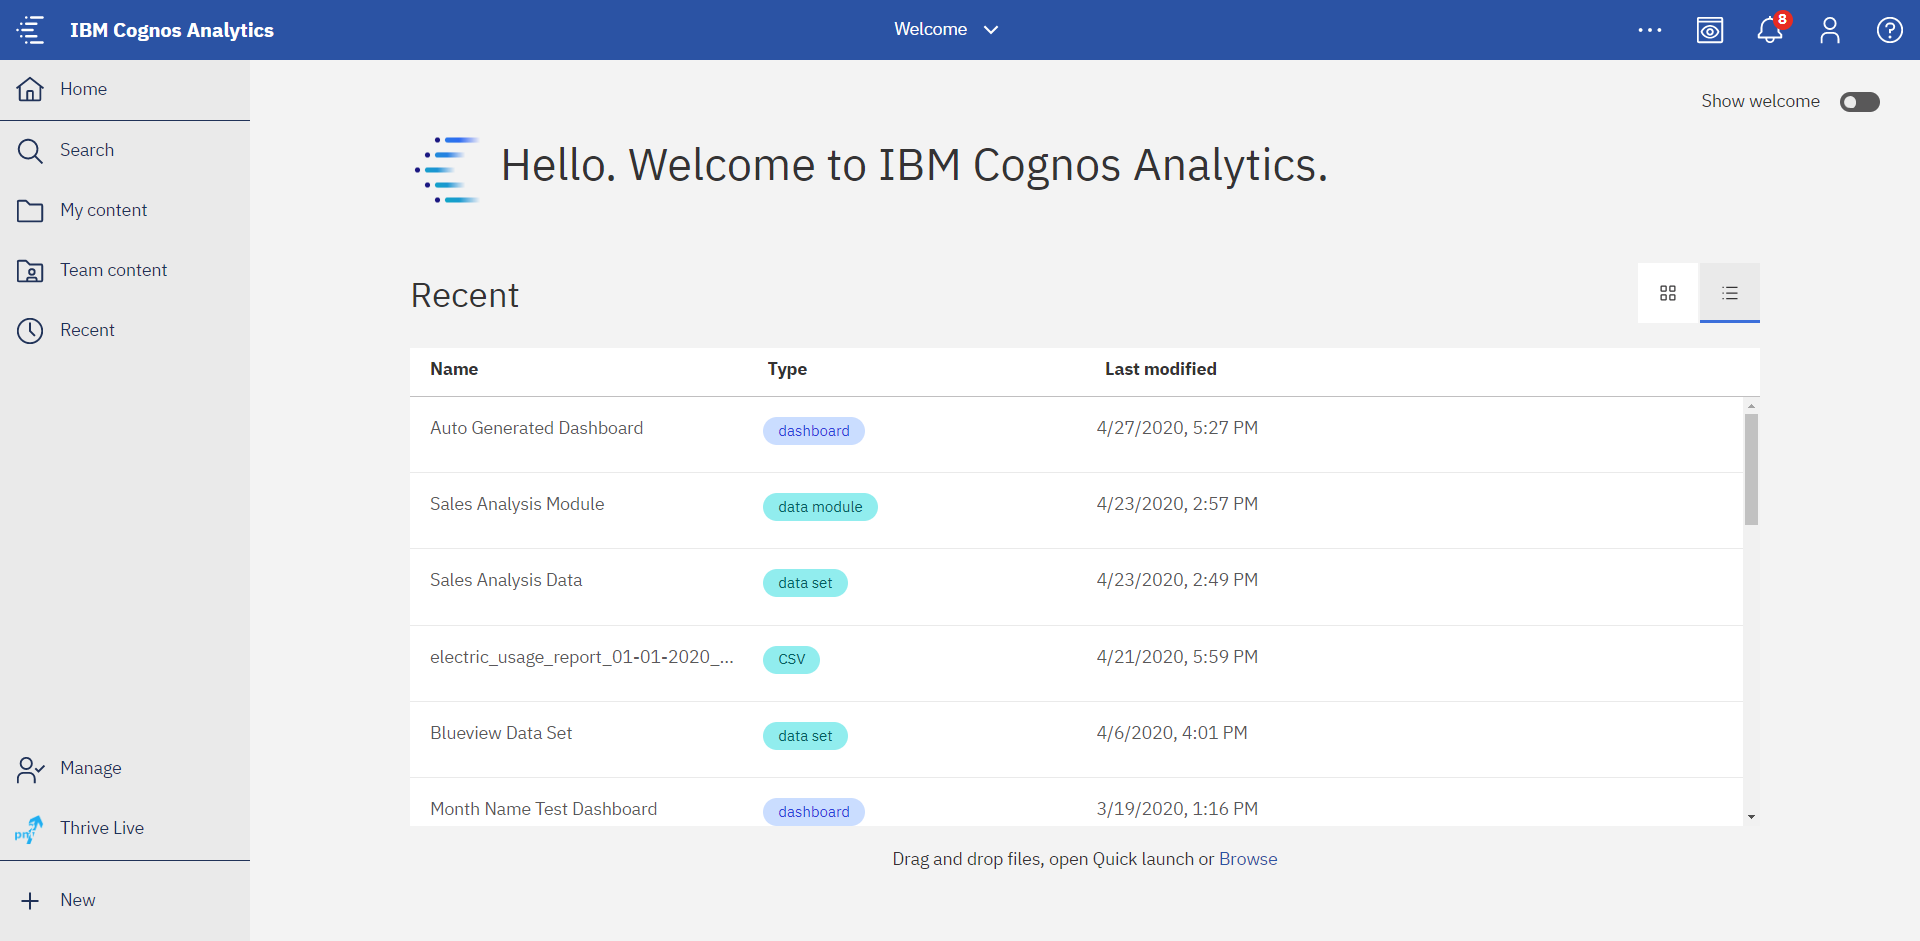
In the latest IBM Cognos Analytics release (11.2.4 FP4), I noticed several improvements that make my workflow smoother and more efficient. The update enhances dashboard functionality with new customization options and a more responsive layout, which helps me create visually appealing and informative dashboards faster. The data module editor has also been improved, making data prep easier with enhanced navigation and editing capabilities. Additionally, the performance boost in loading times and overall system responsiveness means I can access my insights more quickly, helping me make data-driven decisions without delay. These updates collectively make IBM Cognos Analytics a more powerful and user-friendly tool for my analytics needs.
Data security and quality are other critical aspects where Cognos Analytics excels. It provides an environment with multiple levels of administrative permissions, enabling tailored access control and improving individual performance across different departments. This focus on security is a significant consideration for organizations dealing with sensitive or proprietary data.
Compared to alternatives like Sisense and Zoho Analytics, which focus on ease of use through natural language querying and conversational interfaces, I find that IBM Cognos offers more depth for complex data modeling and advanced visual customization. This makes Cognos a better fit for organizations with skilled data teams or those, like us, who need high customization and control over data processes. The recent enhancements to data module editing and faster loading are especially valuable to me when managing large datasets, as I rely on both reliability and performance—something that some lighter, more user-friendly BI tools may not fully provide.
Also read: What Is Data Governance?
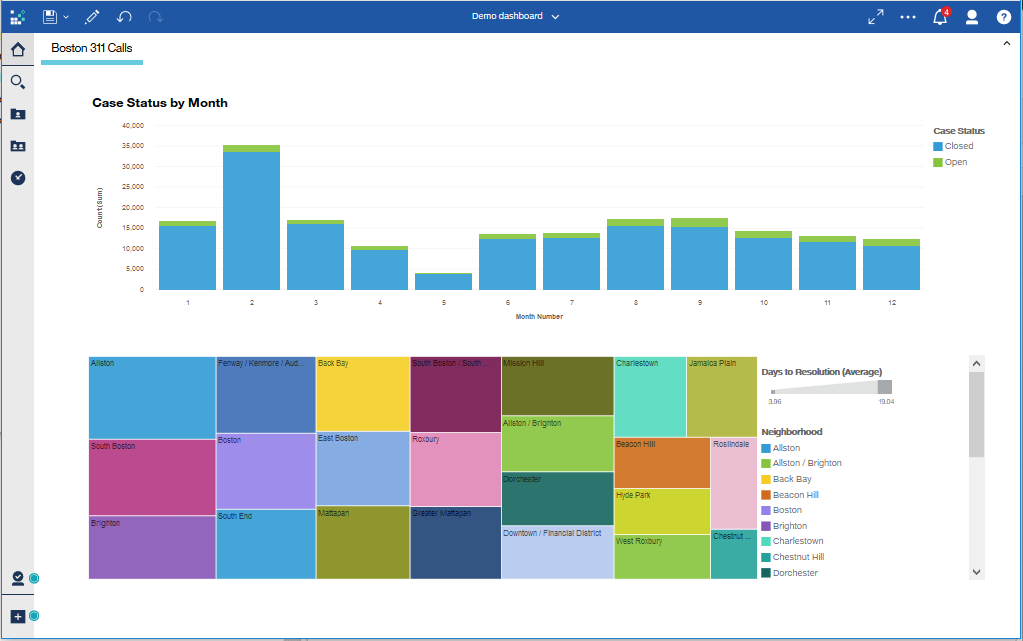
With its advanced reporting and querying capabilities, IBM Cognos Analytics simplifies data analysis and report generation, transforming complex data into meaningful insights. Its intuitive interface allows users to create ad-hoc queries and interact with data on the fly. Furthermore, the platform includes a smart assistant, powered by AI, to help answer questions and uncover patterns in your data.
AI Assistant: IBM Cognos Analytics’ AI Assistant now includes expanded natural language processing (NLP) capabilities, enabling users to interact with data more intuitively. This AI-driven tool not only answers complex queries quickly but also identifies trends, anomalies, and potential areas for deeper analysis. The AI Assistant continues to improve its accuracy and responsiveness with ongoing updates, making data interaction more seamless and insights easier to uncover.
Dashboards and data modules: The dashboards and data modules in Cognos Analytics remain highly robust, with recent improvements enhancing customization options and interactivity. Users can now personalize dashboard layouts further, enabling them to create even more intuitive visualizations and ad-hoc reports that reflect complex data relationships. This toolset still supports a broad view of business data and has added flexibility to accommodate evolving business needs.
Data exploration: The Data Exploration feature in Cognos Analytics facilitates detailed analysis of data, turning complex datasets into easy-to-understand visuals. Users can dive deep into their data, uncover insights, and effectively communicate findings to stakeholders.
Automated Data Preparation: IBM Cognos Analytics automates the data preparation process, significantly reducing the time and effort required to clean and organize data. This feature allows users to quickly prepare data for analysis, ensuring accuracy and consistency across reports.
Enterprise Governance: Cognos Analytics provides robust security and governance tools, which are essential for enterprises managing sensitive data across multiple departments and teams. This feature helps ensure that data usage complies with internal policies and external regulations, maintaining data integrity and security.
Customizable Reporting: IBM Cognos Analytics offers even greater flexibility in reporting, with new options for report layout, formatting, and visualizations. The platform’s recent updates allow users to tailor reports to specific audiences, adding annotations, drill-downs, and data highlights that improve storytelling and actionable insights. This level of customization enhances the overall value of business analysis and reporting for decision-makers.
Free trial available
On Demand: Staring from $10/user/month
On Cloud hosted: Contact IBM for a quote
Client hosted: Contact IBM for a customized quote based on your business needs
Pricing: 3.1/5
General features and interface: 4.1/5
Core features: 4.8/5
Advanced features: 3.5/5
Integration and compatibility: 4.4/5
UX: 4/5
Reporting tools let businesses generate reports and run queries on data. Users can access data from multiple sources, including databases and spreadsheets, to analyze and summarize data through these tools. Reporting tools give users pre-designed report templates for quicker report generation. These templates are often customizable. Users can add or remove fields, change the layout, or modify the formatting to suit their needs.
Querying tools, on the other hand, enable users to extract specific data from a database or spreadsheet by running SQL queries. These tools offer users a way to construct queries without writing code.
Find your new BI software
Business intelligence software benefits
Improved data quality
The best BI tools automatically identifies and cleans up inaccurate, incomplete, or duplicated data, ensuring that only high-quality data is used for analysis. Additionally, it enforces data standards and rules across different systems, ensuring data consistency and accuracy while reducing the risk of errors that can arise from manual data entry. Moreover, companies can gain a fuller picture of what is happening with their business by aggregating different data sources through business intelligence solutions.
Greater transparency
Business intelligence tools give real-time visibility into business operations and performance. This enables organizations to monitor progress and identify potential issues in real time. By providing a thorough view of key metrics, BI software empowers businesses to identify areas for improvement and take corrective action when necessary.
Better decision-making
The software equips organizations with valuable insights into their operations, informing strategic decisions across product development, marketing, sales, and other critical areas. Business intelligence tools also show useful information on employee productivity, revenue, and department-specific performance, allowing organizations to understand their strengths and weaknesses.
By analyzing large volumes of data from different sources, BI software can identify trends and patterns and uncover opportunities. With competitors moving quickly, companies must expedite making accurate decisions to avoid losing customers and revenue.
Increased efficiency
Companies can optimize resources and streamline processes with business intelligence software, decreasing costs and increasing efficiency. The software lets businesses make data-driven decisions to reduce waste by providing information on inventory management, supply chain optimization, and production planning.
Furthermore, business intelligence tools unify multiple data sources, refining the overall data organization so that managers and employees spend less time tracking down information and can focus on producing accurate and timely reports.
Enhanced business margins
Business intelligence software improves business margins by identifying areas where costs can be reduced, such as streamlining supply chains and optimizing inventory management. It can also determine opportunities for revenue growth, like finding high-value customers, analyzing sales trends, and developing marketing strategies. BI software enables organizations to better understand their competitors, market trends, and customer preferences, so they can promptly respond to changing market conditions.
Integration
It’s important to note many BI software solutions integrate with other software systems, including customer relationship management (CRM), enterprise resource planning (ERP), and accounting software. By doing so, companies obtain a more comprehensive view of their operations and performance by combining data from multiple sources. Business intelligence software is crucial for those seeking competitive advantage by utilizing data-driven insights to make better-informed decisions and adapt to shifting market conditions.
What is the business impact of business intelligence software?
Business intelligence software has a significant impact on businesses by providing valuable insights into customer behavior, market trends, and operational inefficiencies, which directly affect a company’s bottom line. It assists organizations in increasing revenue, reducing costs, and improving overall performance.
Today, investing in business intelligence software rather than relying solely on spreadsheets is a logical decision for companies of any kind. BI software handles large volumes of data more efficiently, minimizes the risk of errors, offers a range of analytical tools and visualizations, and brings real-time data updates, which are crucial in fast-paced business environments.
BI software supports businesses better understanding their clients by analyzing customer data to identify trends and preferences. This, in turn, allows organizations to tailor their products and services to meet customer needs, leading to greater customer satisfaction, loyalty, sales, and revenue.
The software also helps businesses uncover operational inefficiencies and bottlenecks by analyzing production processes, supply chains, and employee performance data. Such analysis helps to determine underutilized resources and streamline operations, boosting efficiency and decreasing costs, eventually resulting in higher profitability.
Business intelligence tools facilitate more effective decision-making by presenting accurate and timely data on sales trends, supply chain performance, and other key business metrics. This data allows business leaders to make informed decisions, driving growth and keeping the business ahead of its competition. As a result, companies can swiftly respond to constantly changing market conditions and have better chances of achieving financial success.
Choosing the best software for business intelligence platform
Ready to start your business intelligence software comparison? Our Technology Advisors are here to help you find the perfect tool for your company’s projects. Call for a free 5-minute consultation, or complete the form at the bottom of this page for fast, free recommendations based on your needs.
Frequently Asked Questions (FAQ)
More business intelligence resources