Unlike descriptive and predictive analytics, which focus on understanding past data and predicting future trends, prescriptive analytics provides actionable recommendations on what steps to take next. Below are nine of the best prescriptive analytics tools to help you forecast the business weather and prepare for the storms ahead.
- Alteryx: Best end-user experience
- Azure Machine Learning: Best for data privacy
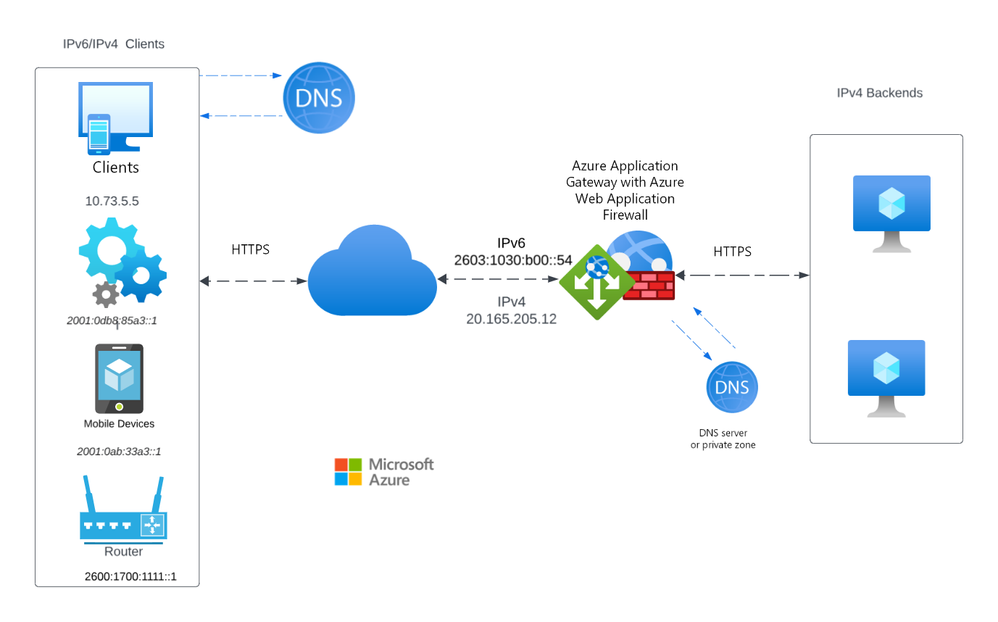
- SAP Integrated Business Planning: Best for supply chain optimization
- Looker: Best for data modeling
- Tableau: Best for data visualization
- Oracle Autonomous Data Warehouse: Best for scalable data management
- RapidMiner Studio: Best for data mining and aggregation
- IBM Decision Optimization: Best for machine learning
- KNIME: Best data science flexibility on a budget
Featured partners
Product
Score
Best For
Key Differentiator
Pricing
Free Trial/Free Plan

Alteryx
4.46
Best end-user experience
User-friendly interface with drag-and-drop functionality
Starts at $4,950/year
Yes/No

Azure Machine Learning
4.40
Best data privacy
Advanced security features and integration with Azure services
Pay-as-you-go pricing
Yes/No
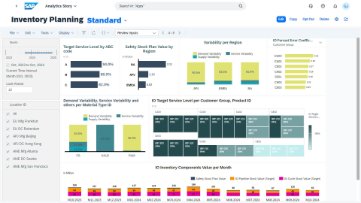
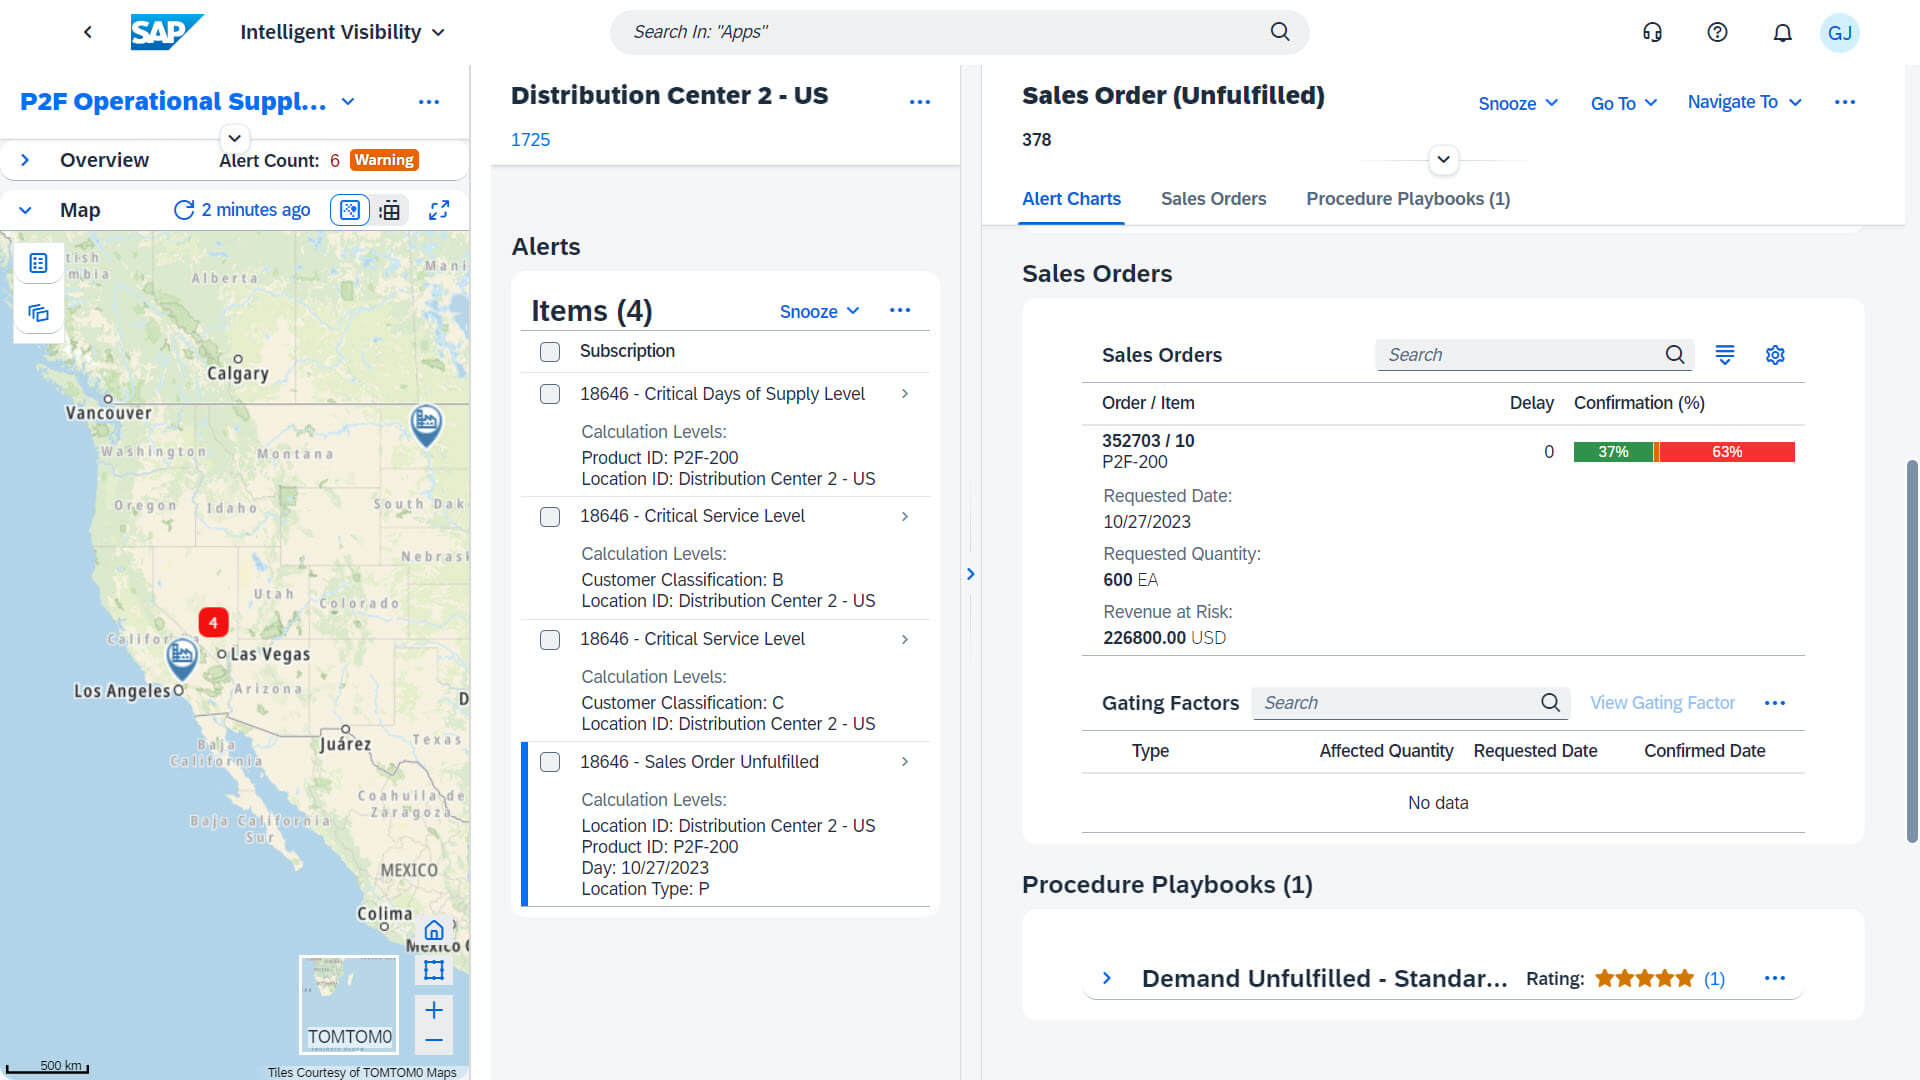
SAP Integrated Business Planning
4.32
Best for supply chain optimization
Real-time supply chain analytics and planning
Subscription-based pricing
Yes/No

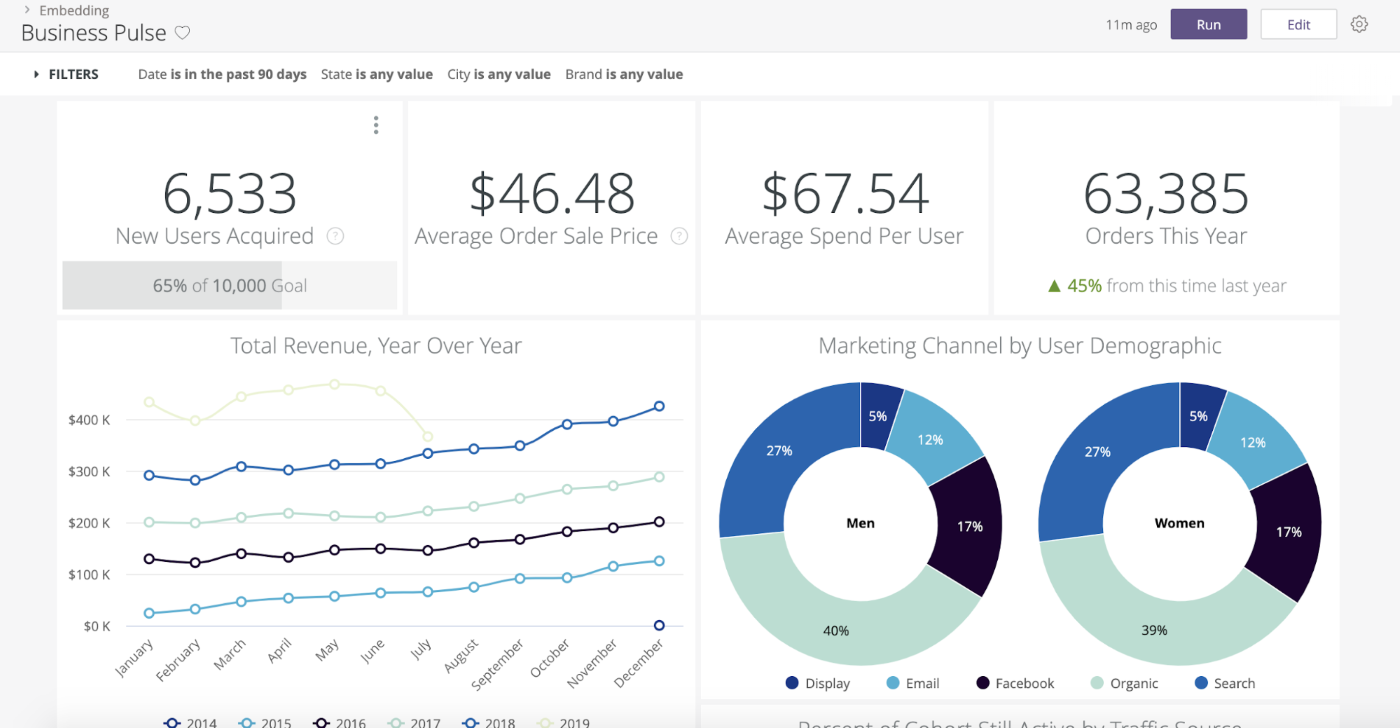
Looker
4.30
Best for data modeling
Strong data modeling capabilities and integration with Google Cloud
Custom pricing
Yes/No

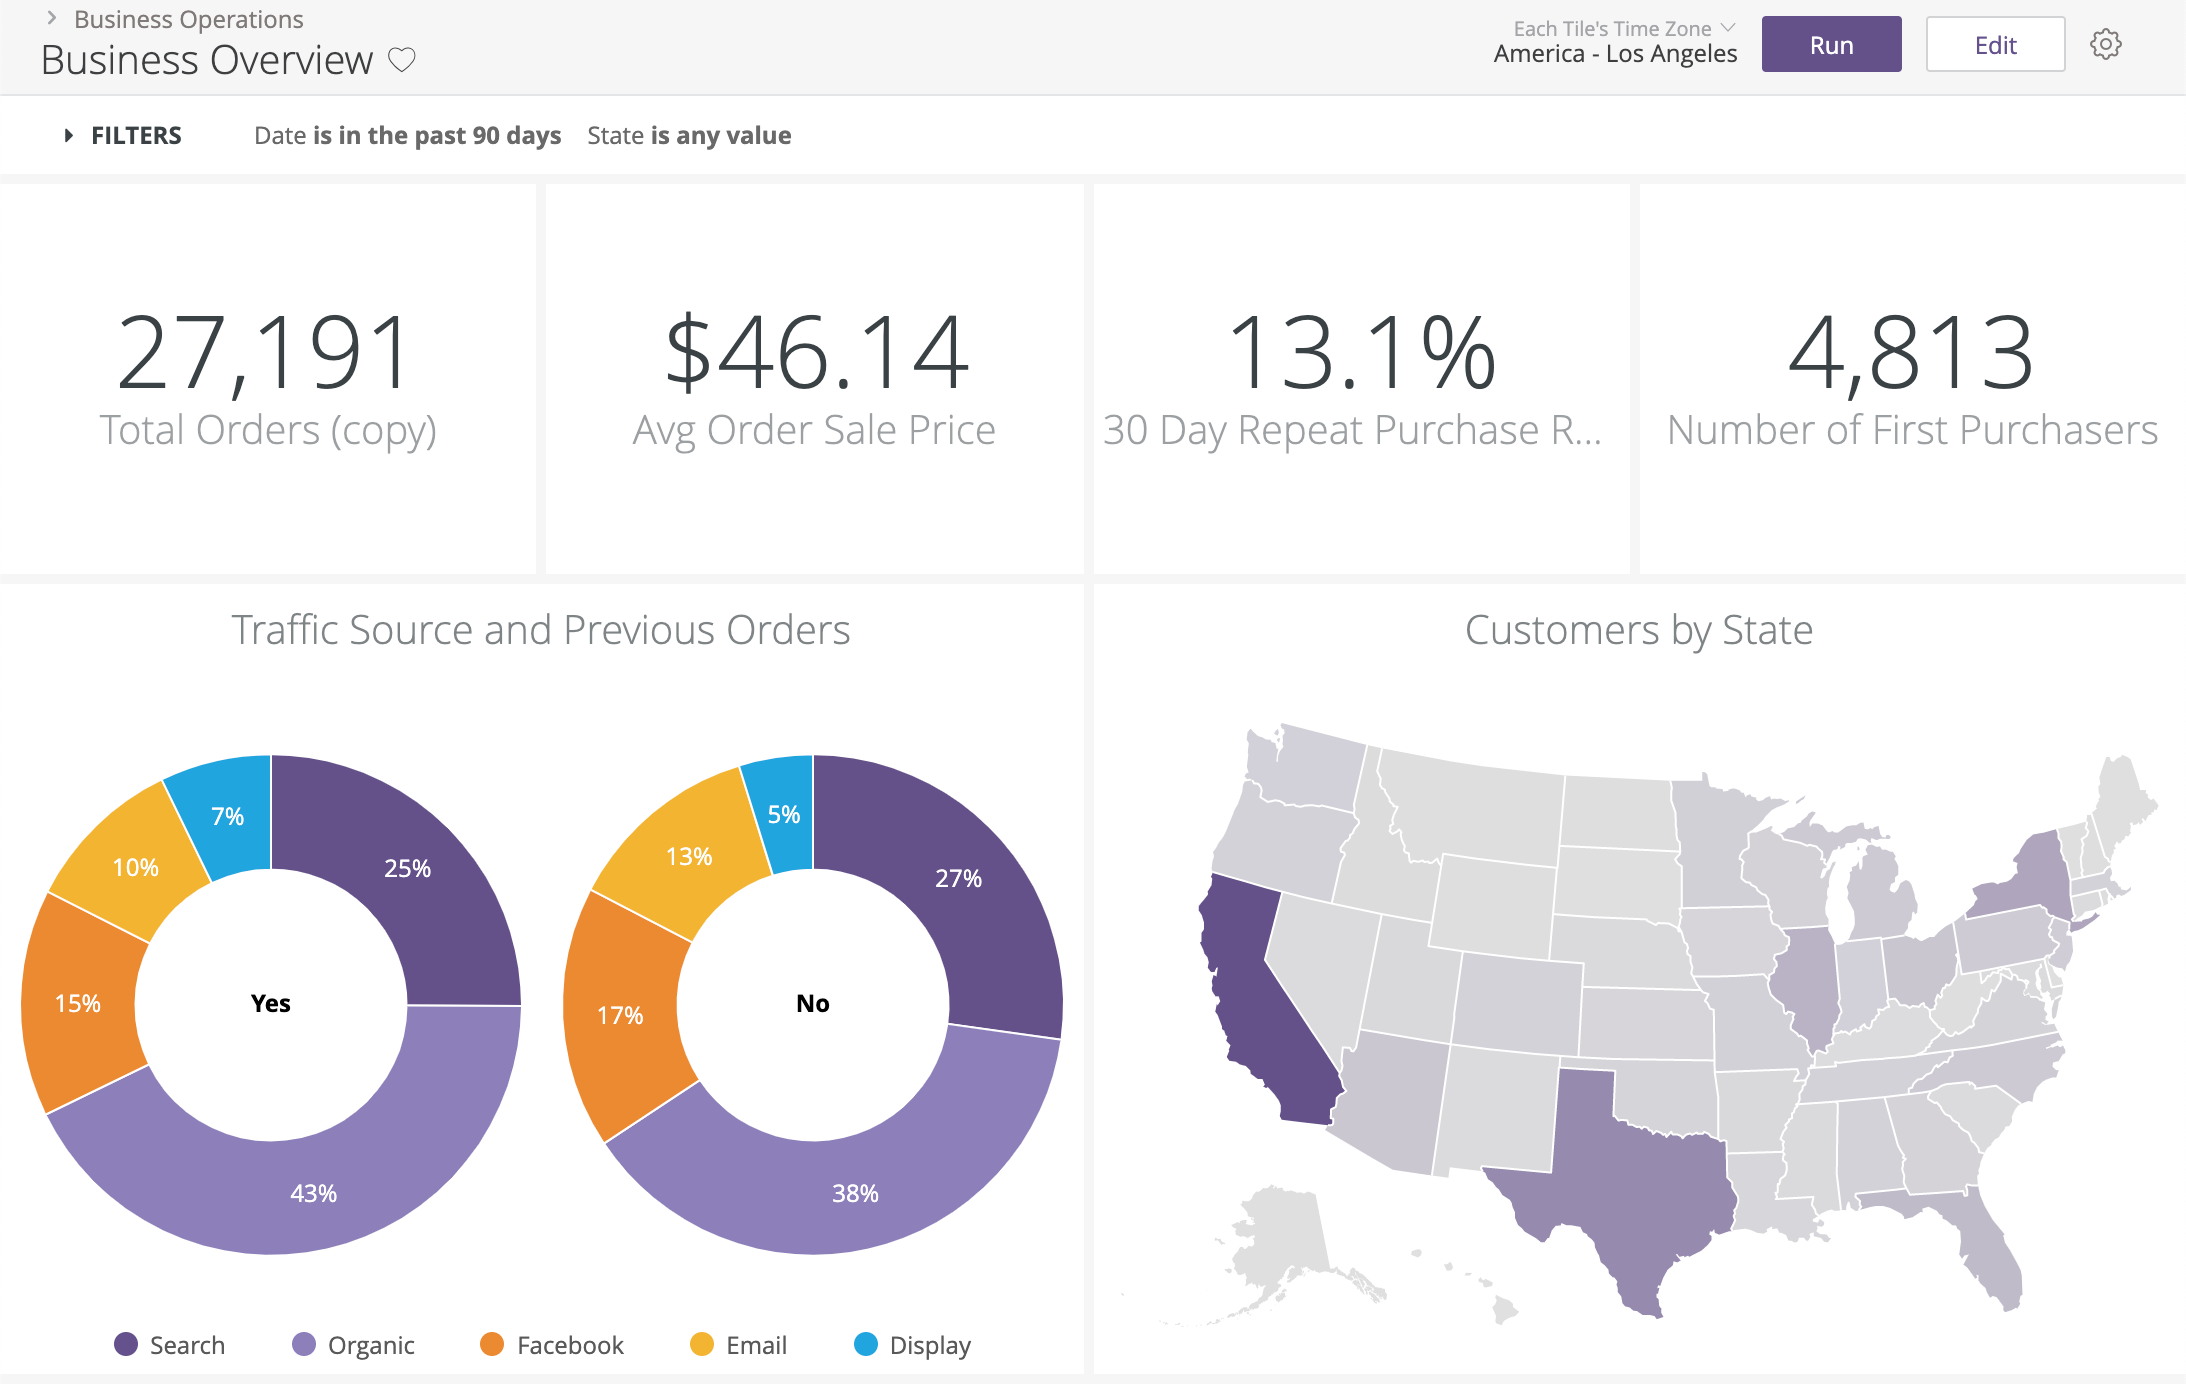
Tableau
4.23
Best for data visualization
Industry-leading data visualization tools
Starts at $75/user/month
Yes/No

Oracle Autonomous Data Warehouse
4.18
Best for scalable data management
Elastic scaling and built-in machine learning capabilities
Based on Oracle Cloud services
Yes/No

RapidMiner Studio
4.18
Best data mining and aggregation
Comprehensive data mining and machine learning tools
Starts at $2,500/year
Yes/Yes
IBM Decision Optimization
4.15
Best machine learning
Powerful optimization solvers and integration with Watson Studio
Starts at $199/user/month
Yes/No

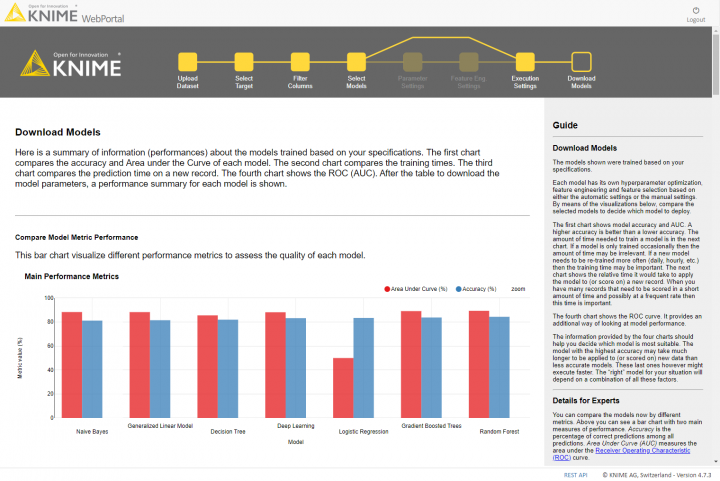
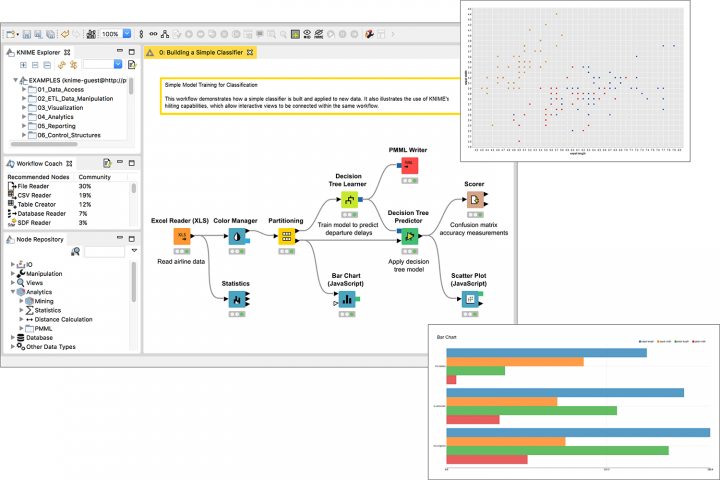
KNIME
4.11
Best data science flexibility on a budget
Open-source platform with extensive data integration capabilities
Free for basic version
Yes/Yes
Alteryx: Best for end-user experience
Overall Score
4.46/5
Pricing
2.7/5
General features and interface
4.7/5
Core features
4.8/5
Advanced features
5/5
Integration and compatibility
5/5
UX
4.3/5
Pros
- Intuitive workflow
- Data blending capabilities
- Advanced analytics
- Data visualization
Cons
- Complex for beginners
- Limited collaboration features
- Cost
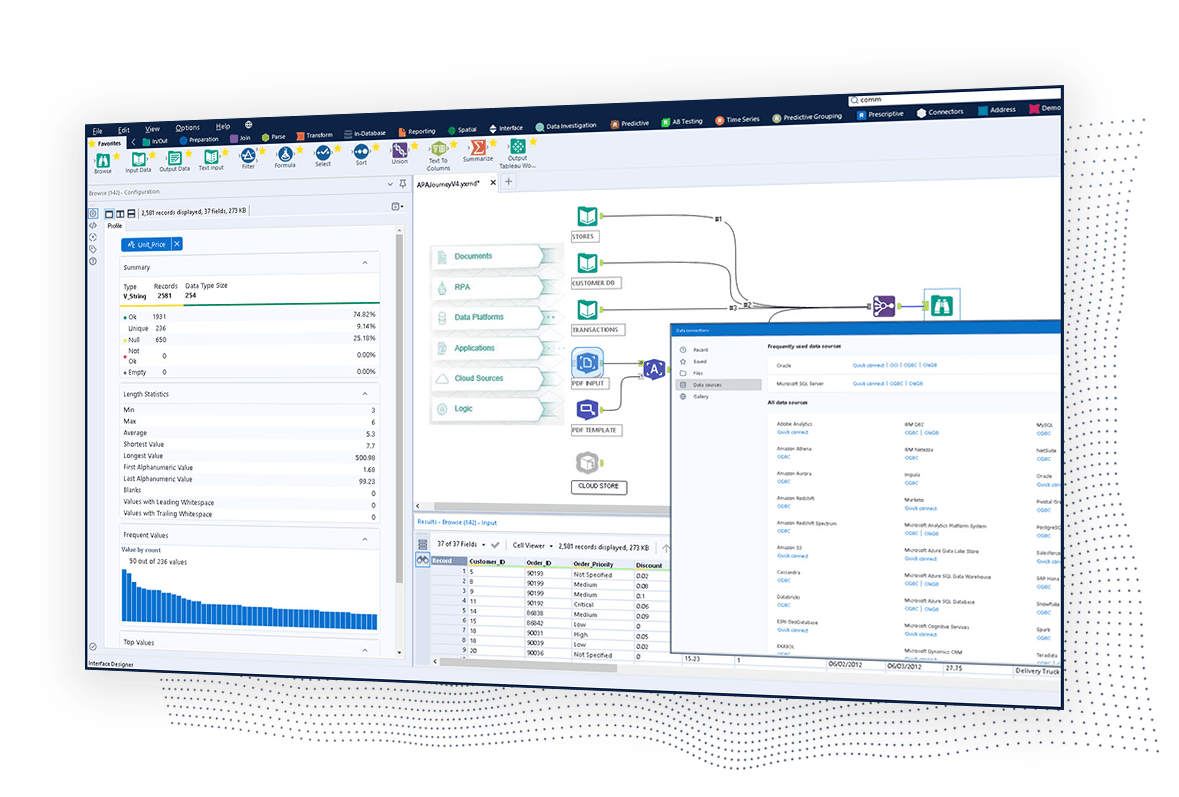
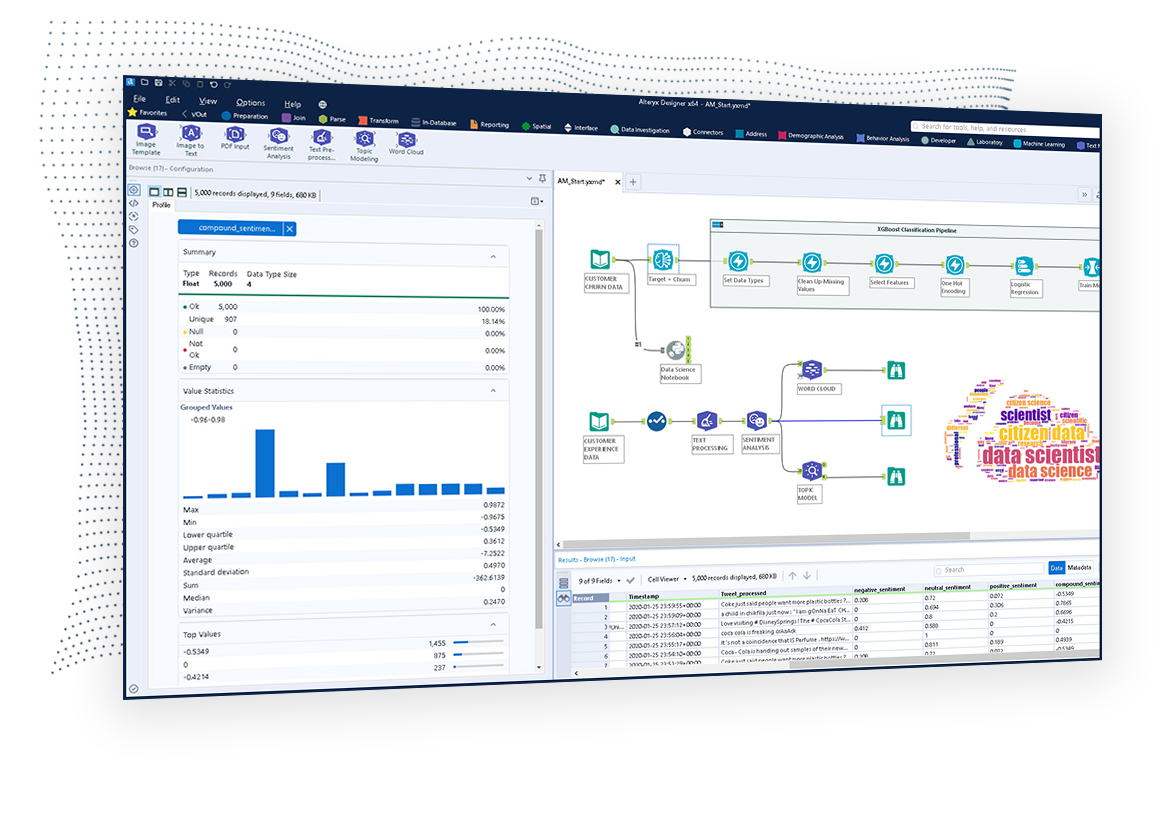
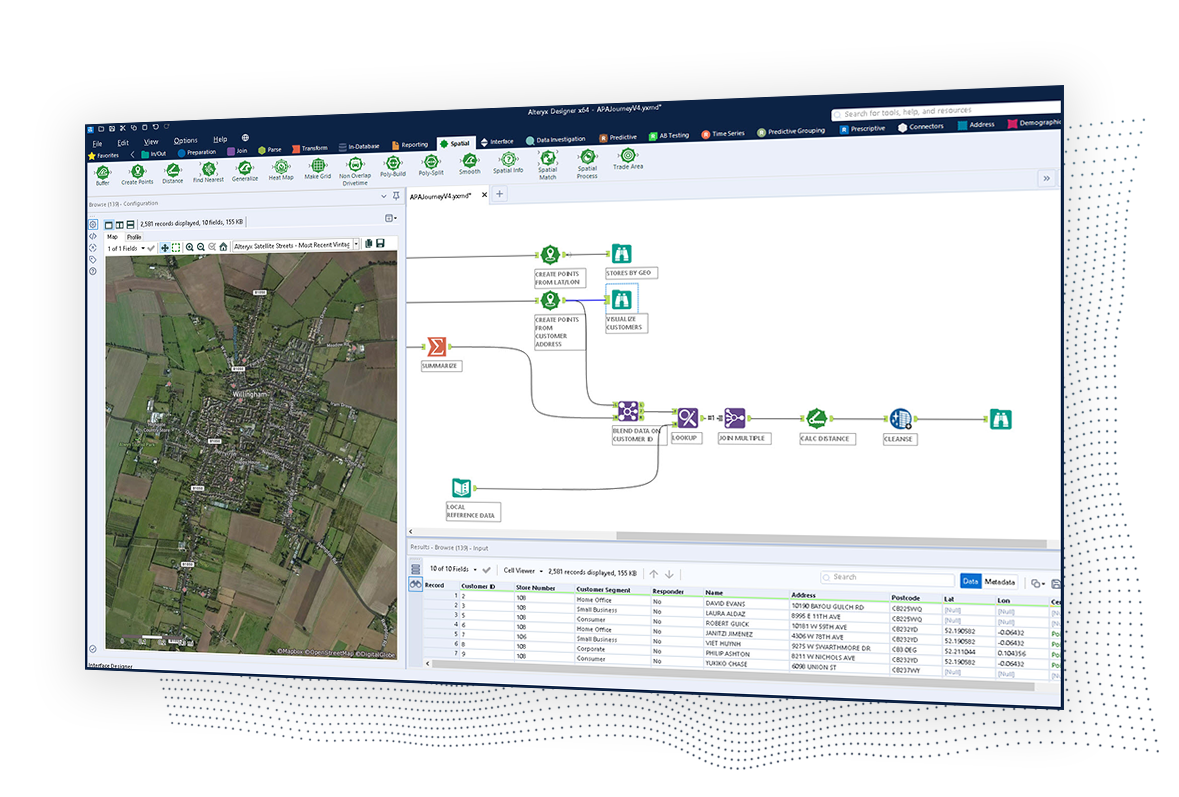
Why we chose Alteryx
Alteryx’s simple interface helps break down complex data workflows, making data analysis accessible even to non-coders. This feature, coupled with a comprehensive suite of pre-built analytic models and an extensive library of connectors, allows you to derive actionable insights seamlessly. Its Alteryx Academy further enhances its usability and facilitates speedy adoption. The availability of Alteryx Community, a platform for peer support and learning, underlines why it is our top choice for the best end-user experience.
KNIME, another strong contender known for its flexibility and budget-friendly options, still falls short in user experience compared to Alteryx. While KNIME offers powerful data analytics capabilities, its interface can be less intuitive, requiring more technical knowledge to navigate. Alteryx, on the other hand, prioritizes maintaining a user-friendly design, making it easier for users at all technical levels to perform complex analytics tasks without extensive training.
Alteryx is your go-to platform for simplifying complex data workflows. Its intuitive drag-and-drop interface makes tasks like data blending, cleansing, and analysis accessible to both technical and non-technical users.
For small businesses up to large enterprises, Alteryx empowers your analysts with advanced analytics capabilities without requiring extensive coding knowledge. You can take advantage of a wide range of data sources and benefit from extensive training resources through Alteryx Academy. For automating repetitive tasks and boosting your data analysis capabilities, Alteryx offers a powerful and user-friendly solution.
Self-service data analytics: Quick and precise insights delivery with an end-to-end platform for data discovery, blending, and analysis.
Drag-and-drop workflow: Easy creation and alteration of analytical workflows through an intuitive user interface.
Predictive analytics: With more than 60 pre-built tools, Alteryx allows the harnessing of advanced analytics for spatial and statistical analysis and predictive modeling without any coding required.
Data connectors: Native data connectors to numerous sources such as SQL, Oracle, Excel, and Access and supports cloud-based data from AWS, Google Analytics, Salesforce, etc.
Free trial available
Designer Cloud: Starting at $4,950/user/year
Designer Desktop: $5,195/user/year
Azure Machine Learning: Best for data privacy
Overall Score
4.40/5
Pricing
2.5/5
General features and interface
4.5/5
Core features
5/5
Advanced features
5/5
Integration and compatibility
5/5
UX
4.5/5
Pros
- Top-notch security
- Built-in privacy features
- Enterprise-level control
Cons
- Dependency on Microsoft ecosystem
- Limitations in free tier
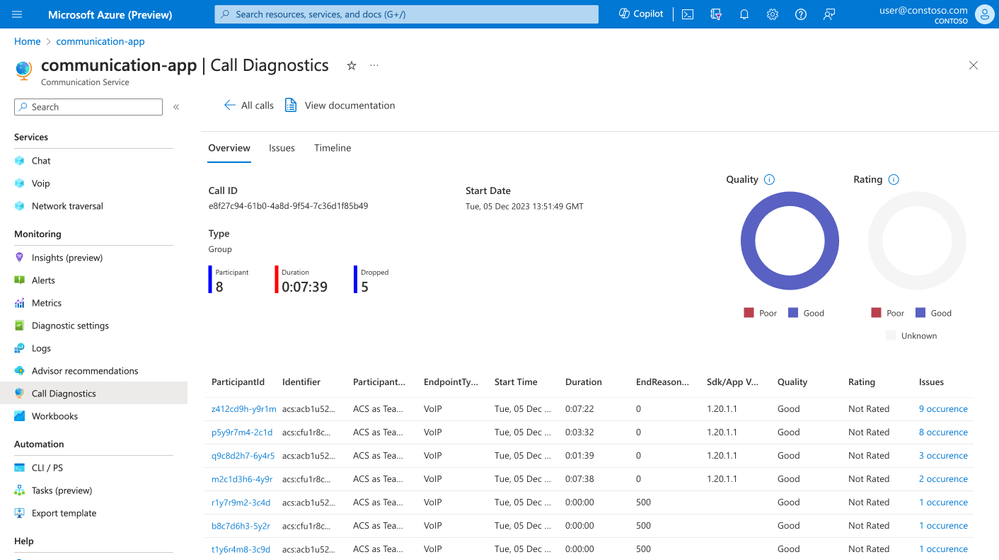
Why we chose Azure Machine Learning
As part of the Azure environment, Azure Machine Learning benefits from all the security features used to protect the cloud service at large. Similar to how Office 365 enables increased controls regarding access privileges, data storage and sharing, and identity management, Azure Machine Learning ensures the safeguarding of connected data pipelines and workflows. Its built-in security measures include advanced threat protection, encryption at rest and in transit, and comprehensive compliance certifications, providing a robust framework for data privacy.
When compared to Oracle Autonomous Data Warehouse, another strong contender known for its security features, Azure Machine Learning stands out particularly in the realm of integrated data privacy. Oracle provides excellent data security and compliance, but Azure’s extensive suite of security tools and seamless integration with other Microsoft services offer a more comprehensive approach to data privacy. Azure’s identity management and access controls, along with its ability to monitor and respond to threats in real-time, give users a higher level of confidence in the protection of their data.
Azure Machine Learning, part of the Microsoft Azure ecosystem, offers a secure and scalable platform for developing and deploying machine learning models.
It integrates with various Azure services and supports multiple development environments, providing you with flexibility in model building and deployment. Advanced tools for automated machine learning, data labeling, and model interpretability make Azure Machine Learning comprehensive for your AI projects. If your enterprise prioritizes data privacy and needs a reliable environment for developing sophisticated machine learning applications, this platform is an excellent choice.
Enterprise-grade MLOps: Build, deploy, and manage machine learning models efficiently at scale, fostering robust operationalization and lifecycle management of your models.
Automated machine learning: Makes the selection and tuning of machine learning models hassle-free, increasing productivity and reducing the possibility of errors.
On-premises, multi-cloud, and at-the-edge deployment: Flexibility to deploy your machine learning models wherever you need them.
Explainability and fairness of models: Includes built-in features for model interpretability and fairness.
Security and compliance: Provides advanced security controls and privacy-preserving features, including differential privacy and confidential computing.
Integrated notebooks: Offers Jupyter Notebooks as part of the service.
Studio
- Free plan: Available, no Azure subscription required.
- Standard: $9.99/user/month plus $1 per studio experimentation hour; Azure subscription required. Unlimited modules and storage, experiments can last up to 7 days, with a maximum of 24 hours per module.
Production Web API
- Web API Dev/Test: Free. Includes 1000 transactions per month, 2 compute hours, and 2 associated web services.
- Web API Standard S1: $100.13/user/month, includes 100,000 transactions and 25 compute hours per month. Overage rates are $0.50 per 1,000 transactions and $2 per API compute hour.
- Web API Standard S2: $1,000.06/user/month; includes 2,000,000 transactions and 500 compute hours per month. Overage rates are $0.25 per 1,000 transactions and $1.50 per API compute hour.
- Web API Standard S3: $9,999.98/user/month; includes 50,000,000 transactions and 12,500 compute hours per month. Overage rates are $0.10 per 1,000 transactions and $1 per API compute hour.
SAP Integrated Business Planning: Best for supply chain optimization
Overall Score
4.32/5
Pricing
2.9/5
General features and interface
4.5/5
Core features
5/5
Advanced features
5/5
Integration and compatibility
4.3/5
UX
4.2/5
Pros
- Immediate insights from live data integration
- Scenario planning
- Short-term demand sensing for accuracy
- Single unified data model
- Supply chain control tower
- Strong ERP integration
Cons
- High implementation cost
- Complex integration
Why we chose SAP Integrated Business Planning
With the full might of SAP’s suite behind it, you can ensure seamless data flow and consistency across business processes. This makes SAP IBP particularly effective for organizations looking to optimize their supply chain operations comprehensively and efficiently.
SAP IBP integrates key planning processes, including demand sensing, inventory optimization, and sales and operations planning, into a single unified platform.
SAP IBP provides end-to-end supply chain visibility and advanced predictive analytics tailored specifically for supply chain management. While Oracle focuses on data management and processing, SAP IBP offers specialized modules for supply chain operations, including demand-driven replenishment and supply chain control tower capabilities, which are not as deeply embedded in Oracle’s offering.
SAP Integrated Business Planning (IBP) offers a comprehensive solution for managing your supply chain, providing advanced tools for demand planning, inventory optimization, and sales and operations planning.
It processes real-time data and uses predictive analytics to deliver accurate forecasts and scenario planning. SAP IBP’s collaboration features facilitate coordination across your business units, improving overall supply chain efficiency. If you are seeking to optimize your supply chain operations with extensive customization options and scalability, SAP IBP meets the needs of businesses of all sizes, enhancing your supply chain performance through data-driven insights.
Also read: Best Embedded Analytics Tools 2024
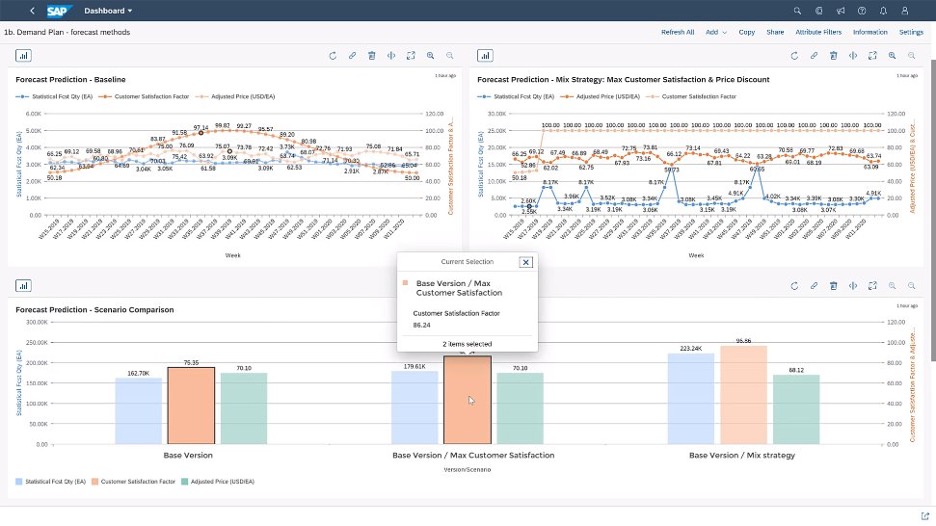
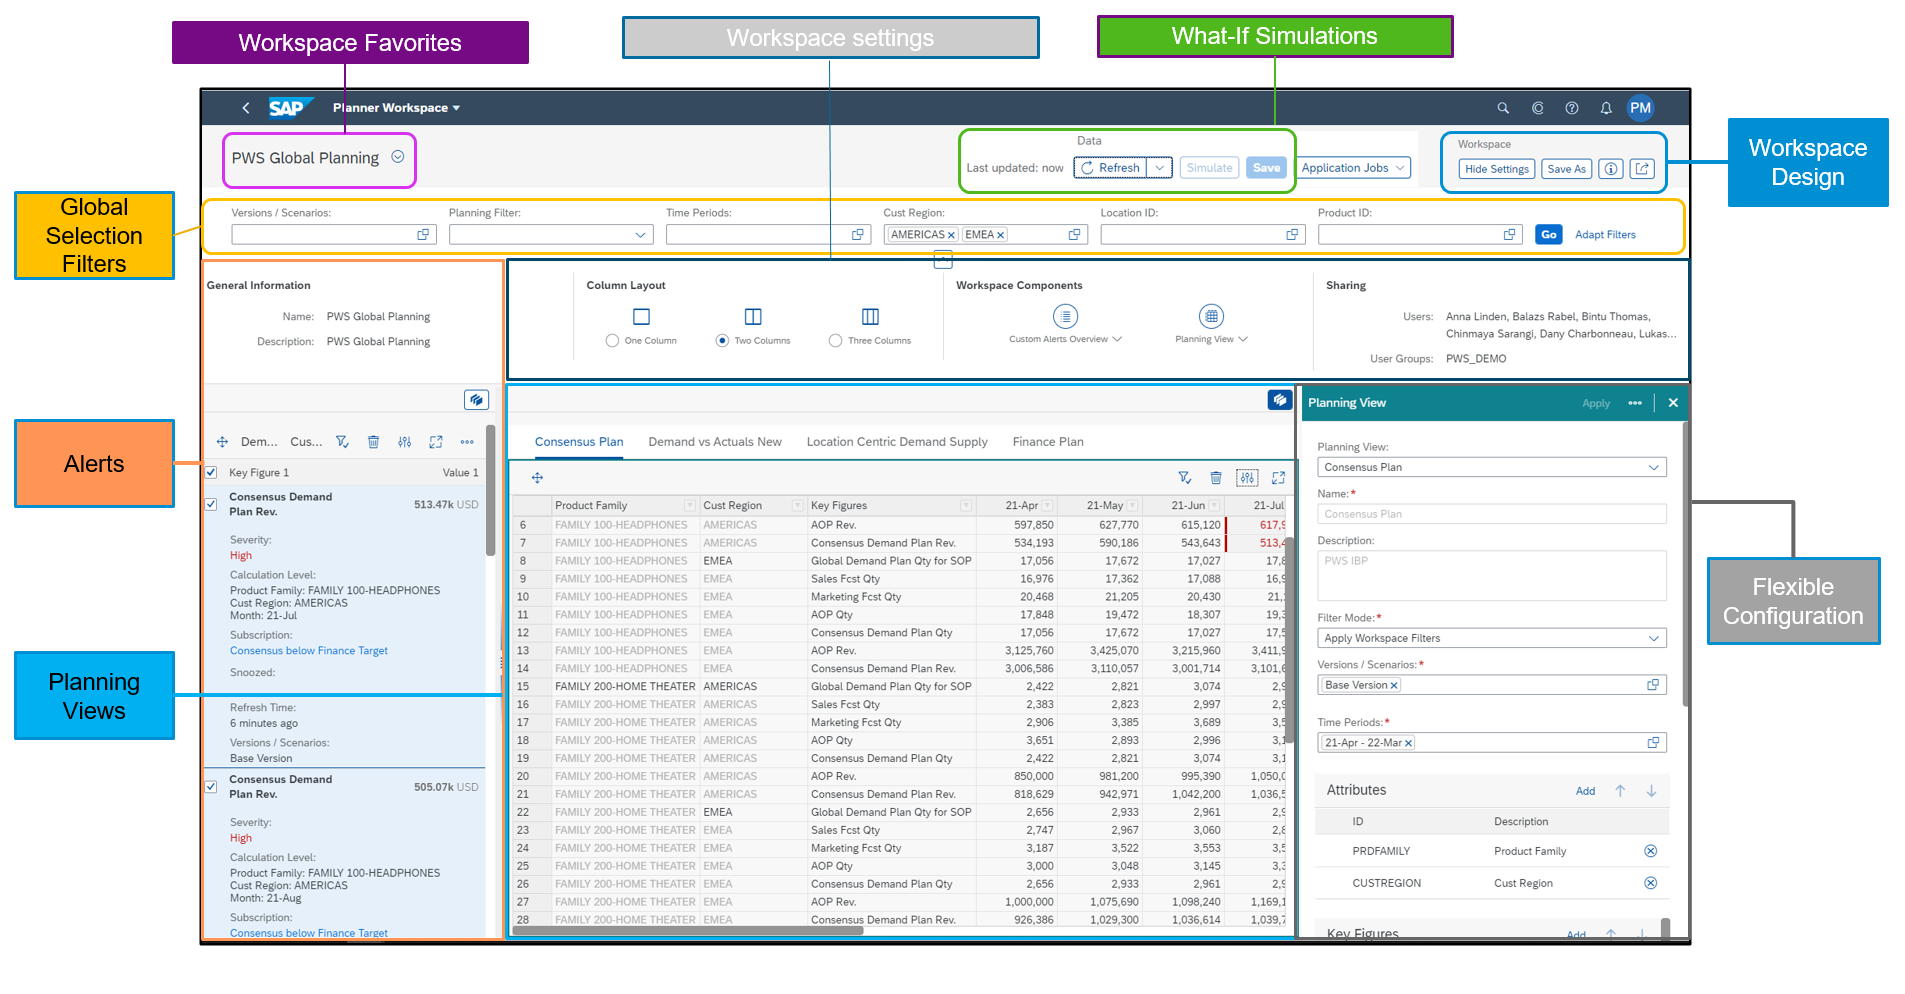
Scenario planning: Enables users to perform ‘what-if’ analysis to predict the impact of different scenarios.
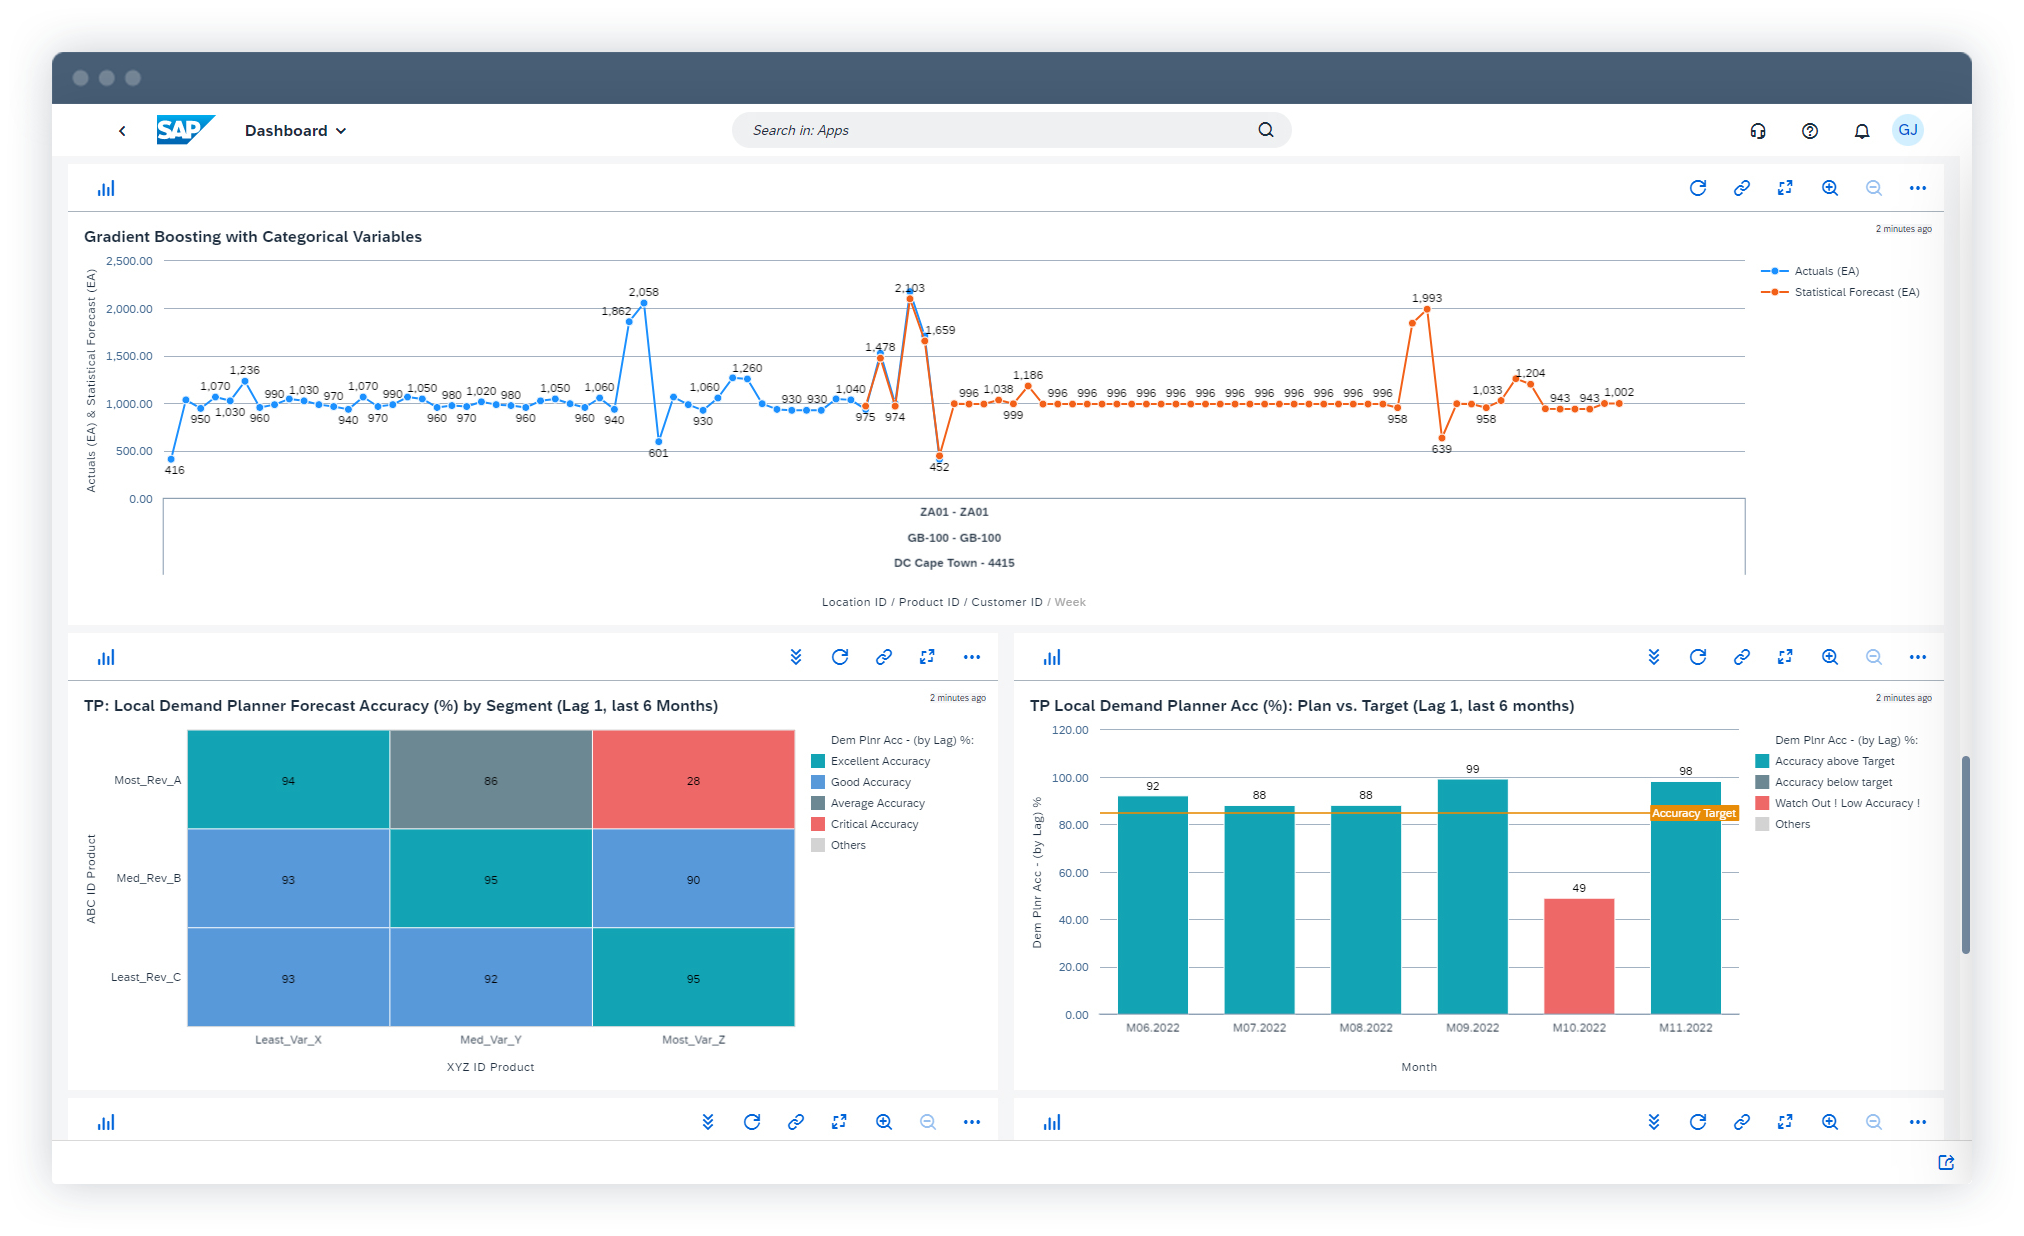
Demand sensing: Utilizes short-term historical data to improve forecast accuracy.
Supply chain control tower: Offers end-to-end visibility and monitoring of the entire supply chain.
Unified data model: Maintains a single data model for enhanced collaboration and consistency across functions.
Integrated with SAP ERP: Seamlessly connects with SAP ERP and S/4HANA for comprehensive planning and execution.
Inventory optimization: Helps in optimizing inventory levels to balance service levels and costs.
Order-based planning: Supports planning at the order level for precise supply chain management.
SAP IBP Starter Edition:
- Contract Duration: 3 months
- Pricing: $31,260.00
- Includes:
- SAP Cloud Integration Services
- SAP Cloud Identity Services
- SAP IBP modules for demand, inventory, response and supply, sales and operations, and Supply Chain Control Tower
- User Limit: Up to 10 concurrent users
- Data Limit: Up to 50 million total planning points
More Specific Versions of SAP IBP:
- There are diffent tiers depending on specific needs
- Contract Duration: Customizable based on business needs
- Pricing: Subscription-based, with detailed pricing available upon request
- Includes: All features of the Starter edition plus additional functionalities and higher data limits
- User Limit: Scalable based on subscription tier
- Support: Premium consulting and integration services available
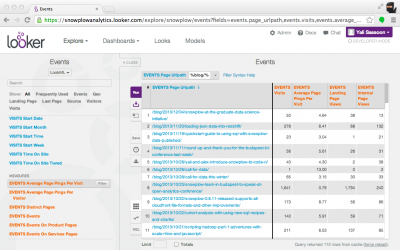
Looker by Google: Best for data modeling
Overall Score
4.30/5
Pricing
3.3/5
General features and interface
3.9/5
Core features
3.5/5
Advanced features
5/5
Integration and compatibility
5/5
UX
3.5/5
Pros
- Built-in IDE for data modeling
- Versatile data access
- Enhanced collaboration
- Integration with R
Cons
- Dependency on LookML
- Limited pre-built visualization types
- Performance scaling issues reported
Why we chose Looker by Google
Looker’s secret weapon is its ability to create powerful, scalable data models using its LookML language. It allows teams to curate and centralize business metrics, fostering better data governance. Plus, its in-database architecture means models can handle large datasets without performance trade-offs. Looker’s versatility and adaptability, including its integration capabilities with SQL and other data sources, make it ideal for businesses that need an intuitive data modeling platform.
The platform’s most natural competitor, Tableau, still leaves something to be desired when it comes to data modeling. Tableau’s strengths lie in its visual analytics, but it falls short in its data modeling capabilities. Looker allows for more sophisticated and reusable data models through LookML, ensuring centralized management and consistency across the organization. Looker’s ability to integrate with SQL databases without data extraction enhances its performance, making it more efficient.
Looker, part of Google Cloud, specializes in data modeling capabilities using its proprietary LookML language.
This platform is ideal if your team needs scalable, centralized business metrics to enhance data governance. Looker processes data within the database itself, maintaining high performance even with large datasets. If you require comprehensive data modeling, Looker integrates smoothly with various SQL databases and other data sources. Its ability to create detailed visualizations and dashboards supports your organization in making strategic, informed decisions.
LookML data modeling: Looker’s proprietary language, LookML, offers a code-based approach to defining business logic and data relationships, providing granular control over how data is queried and visualized.
Data blocks: Pre-modeled pieces of business logic or whole datasets from third-party sources that can be natively integrated into your existing models.
Looker actions: Allows users to take meaningful actions on insights directly from within Looker, like changing data in your database, sending an email, or creating a task in project management software.
Embedded analytics: Looker’s Powered by Looker platform enables you to embed real-time analytics and data visualizations directly into your workflows, applications, or portals.

Viewer User: $30/user/month
Standard User: $60/user/month
Developer User: $125/user/month
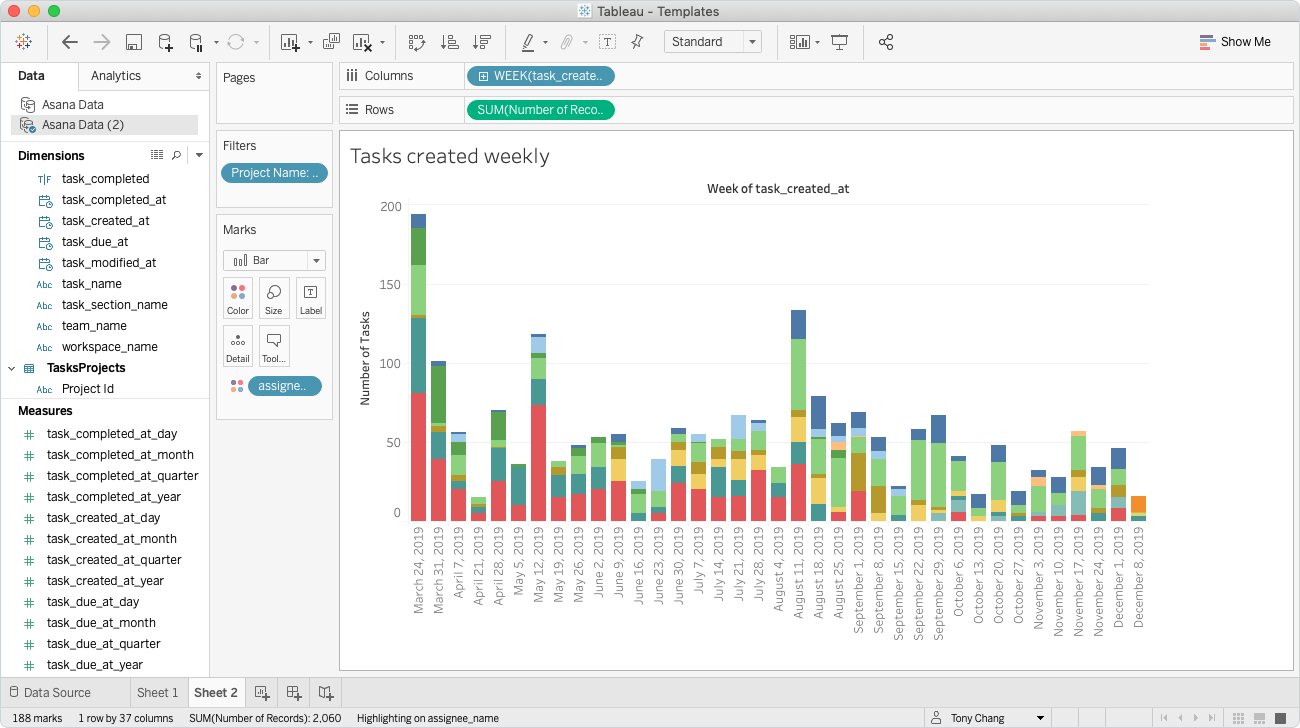
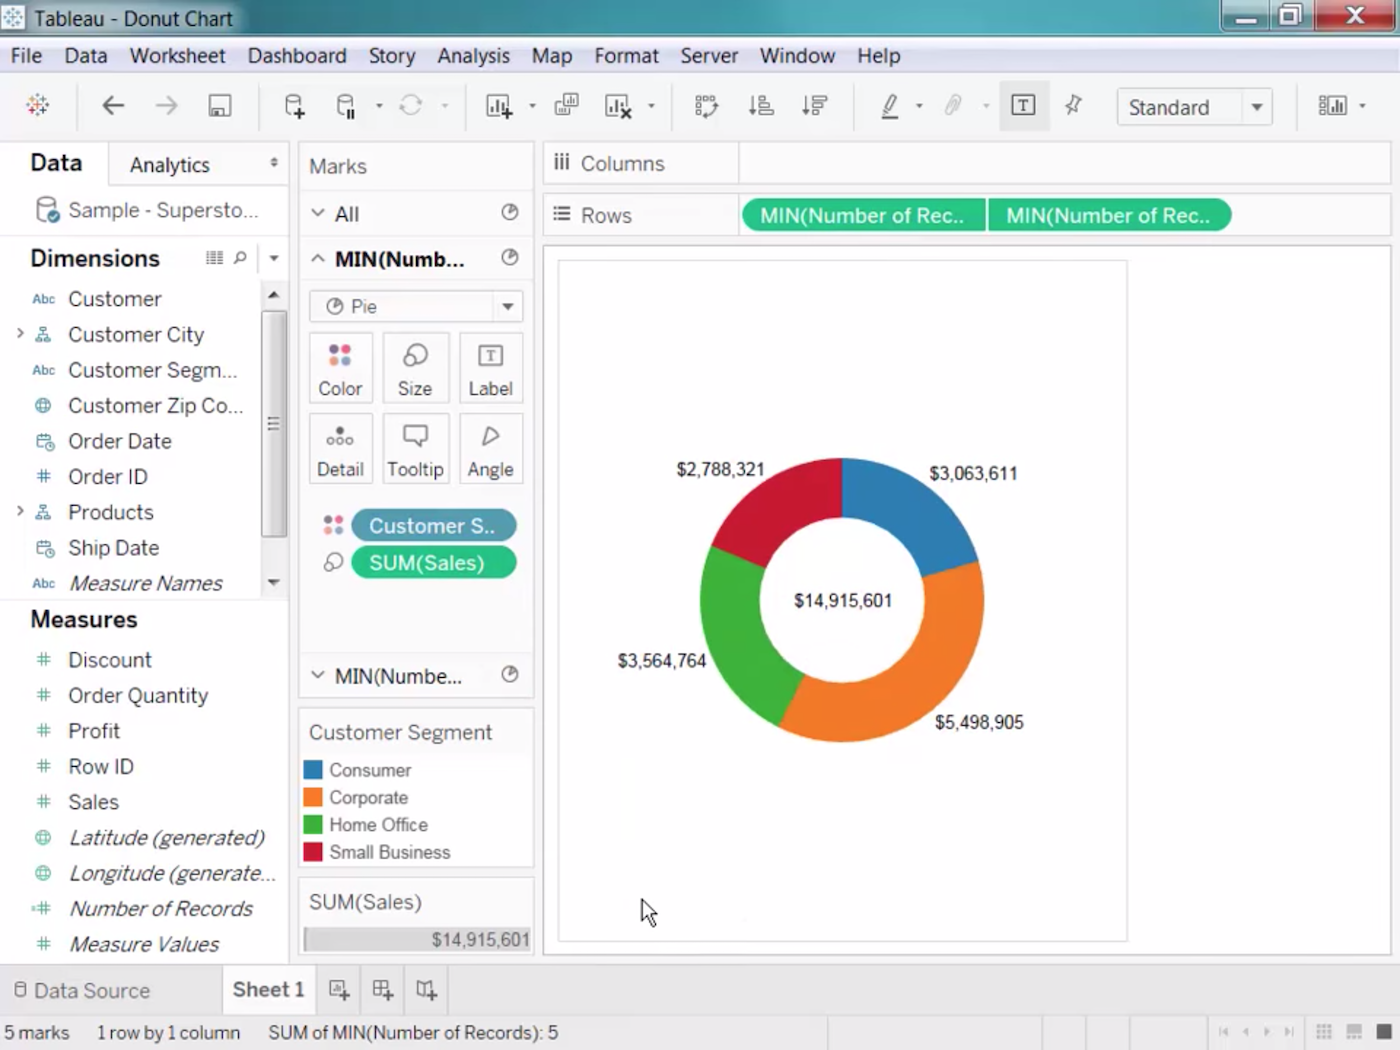
Tableau: Best for data visualization
Overall Score
4.23/5
Pricing
2.1/5
General features and interface
4.3/5
Core features
4.8/5
Advanced features
5/5
Integration and compatibility
5/5
UX
4/5
Pros
- User-friendly interface
- Wide range of visualization options
- Powerful data handling
- Strong community and resources
Cons
- Data connectivity issues
- Limited data preparation
- Costly for large teams
Why we chose Tableau
Tableau is well-known for its ability to turn complex data into comprehensible visual narratives. Its intuitive, drag-and-drop interface makes it accessible for non-technical users while still offering depth for data experts. The large array of visualization options, from simple bar graphs to intricate geographical maps, allows for highly customized presentations of data. With top-notch real-time analytics, mobile-ready dashboards, and secure collaboration tools, Tableau proves to be an invaluable asset for quick, accurate decision-making.
When compared to Microsoft Power BI, another platform known for its data visualization, Tableau excels in providing more sophisticated and customizable visualization options. While Power BI integrates well with other Microsoft products and offers competitive pricing, its visualization capabilities are not as advanced or flexible as Tableau’s. Tableau’s ability to handle large datasets and perform real-time analytics without compromising performance sets it apart. Additionally, its extensive community support and continuous updates ensure that it remains at the forefront of data visualization technology.
Tableau transforms complex data into clear, comprehensible visual narratives. Its drag-and-drop interface is designed for users of all technical levels, making it easy to create a wide array of visualizations, from simple charts to intricate maps.
If you need to present data visually in an engaging and understandable way, Tableau should be at the top of your list. The platform supports real-time analytics and mobile-ready dashboards, providing you with immediate access to insights. Collaboration tools make it easier for your teams to work together on data projects, improving overall efficiency and understanding.
- Data blending: Enables users to blend data from multiple sources, providing a unified view of multiple datasets.
- Drag-and-drop interface: Users can create complex visualizations using a simple drag-and-drop mechanism.
- Real-time data analysis: Real-time data analysis allows for up-to-the-minute business insights and decision making.
- Interactive dashboards: Lets users drill down into charts and graphs for more detail.
- Tableau Public: A free service that allows users to publish data visualizations to the web. These can be embedded into webpages and blogs, shared via social media or email, and made available for download for other users.
- Mobile-ready dashboards: Dashboards are optimized for tablets and smartphones, enabling users to access their data anytime, anywhere.

Free plan available
Tableau Creator: $75/user/month
Add-ons:
- Tableau Viewer: $15/user/month
- Tableau Explorer: $42/user/month
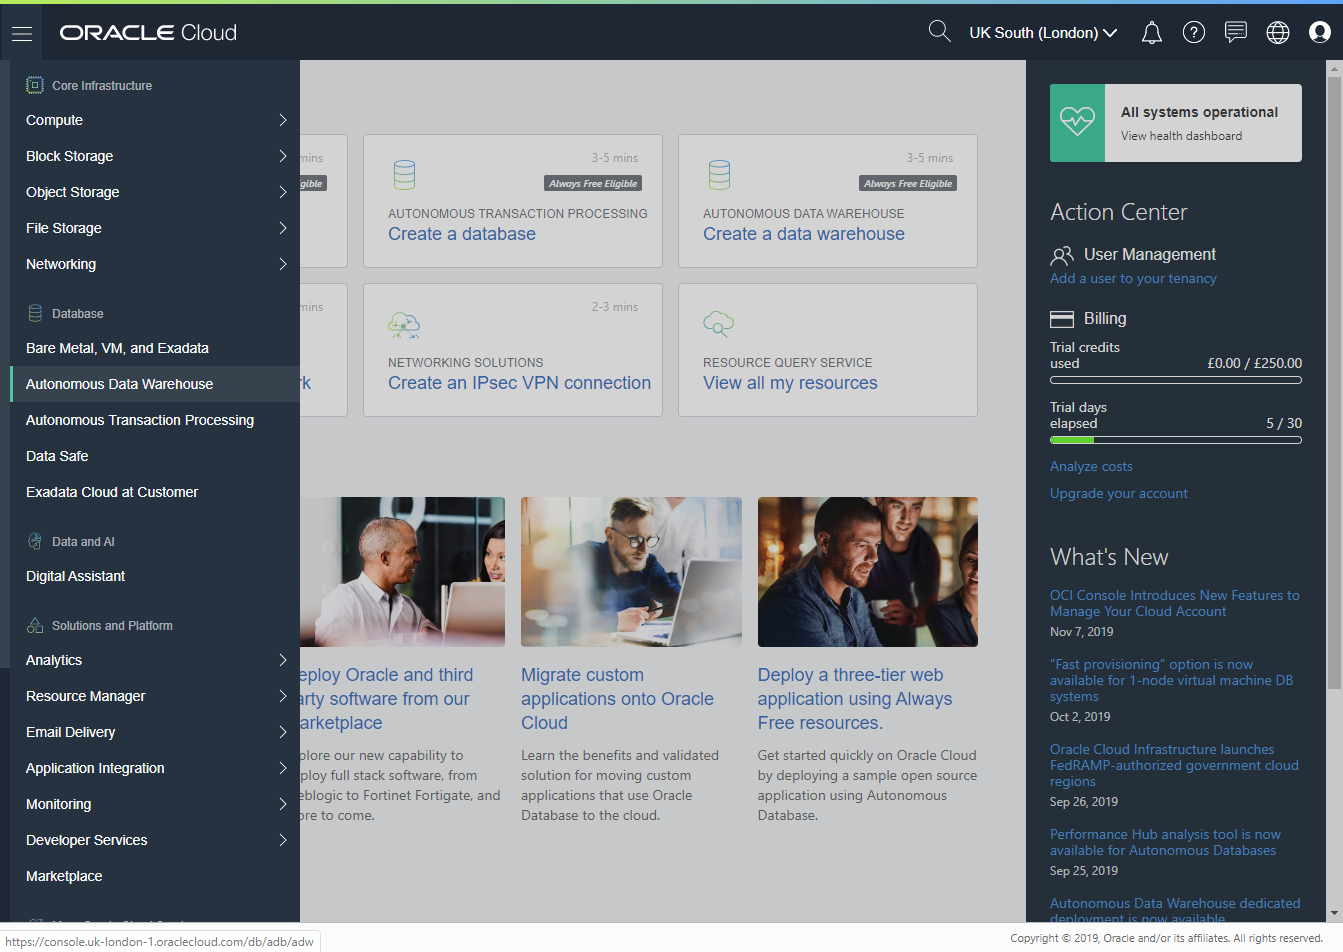
Oracle Autonomous Data Warehouse: Best for scalable data management
Overall Score
4.18/5
Pricing
2.5/5
General features and interface
4.2/5
Core features
5/5
Advanced features
5/5
Integration and compatibility
4/5
UX
4/5
Pros
- Optimized query and workload handling
- Integrates with Oracle services
- Elastic scaling
- Self-managing automation
Cons
- Dependency on Oracle ecosystem
- Complex auto-scaling management
Why we chose Oracle Autonomous Data Warehouse
Oracle Autonomous Data Warehouse is designed to take the heavy lifting out of database operations while delivering impressive performance and adaptability. Imagine a system that grows with your business, automatically adjusting its resources based on your needs.
While IBM brings strong machine learning capabilities to the table, it can’t match Oracle’s seamless scalability and automated management. Oracle goes a step further by baking machine learning right into the system, helping to fine-tune performance, bolster security, and streamline backups.
But it’s not just about handling more data. Oracle’s system plays well with others, integrating smoothly with its cloud ecosystem and a variety of enterprise tools.
Perhaps most impressively, Oracle allows you to perform sophisticated data analysis and predictive modeling right within the warehouse. This in-database machine learning feature is a game-changer for efficiency and insights.
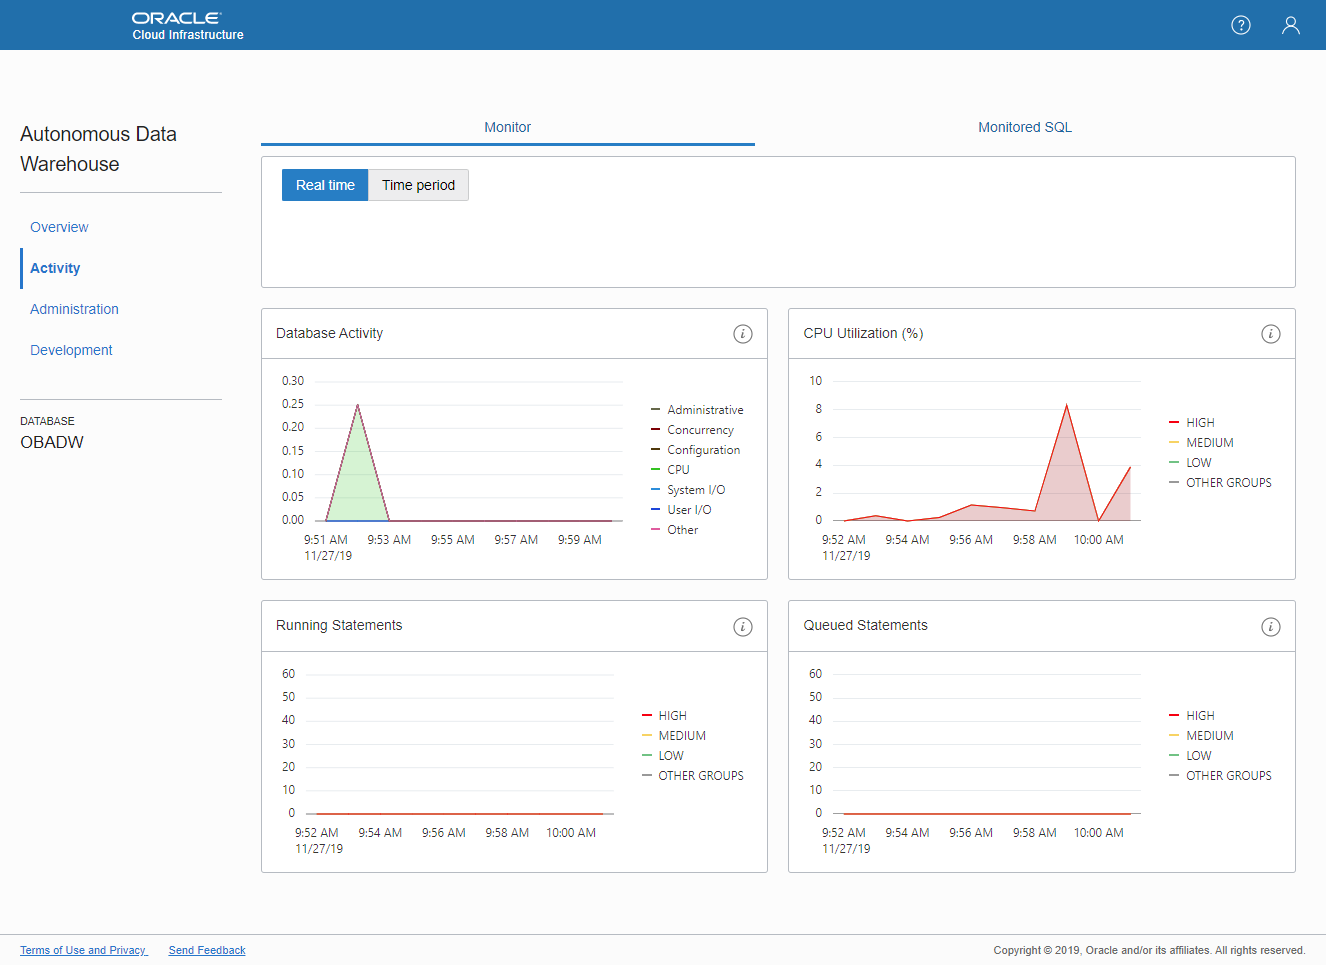
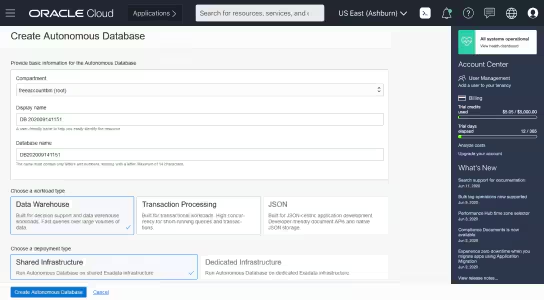
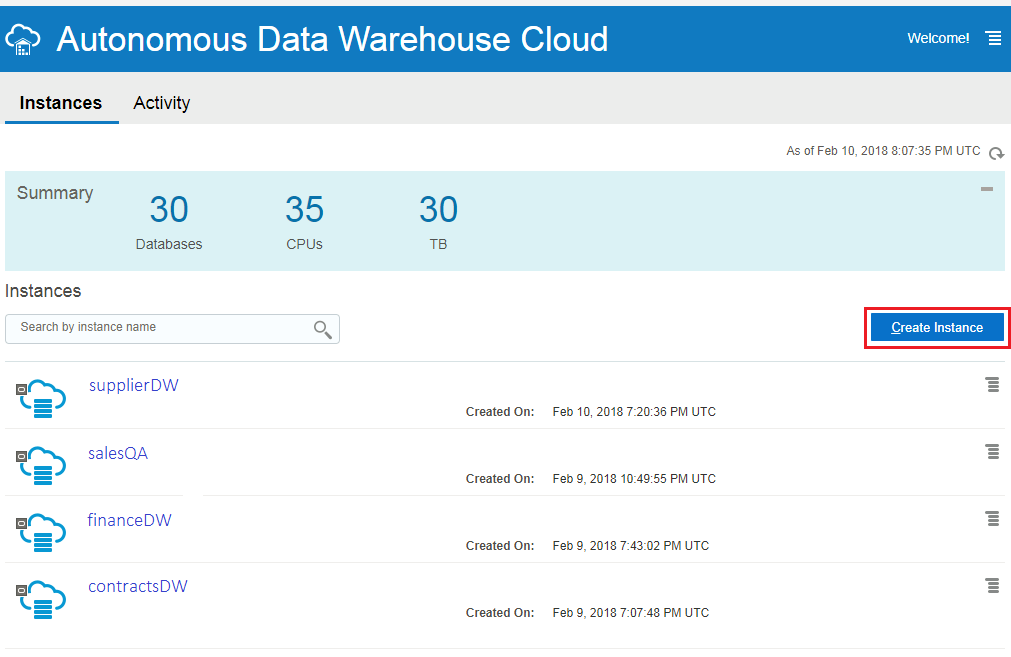
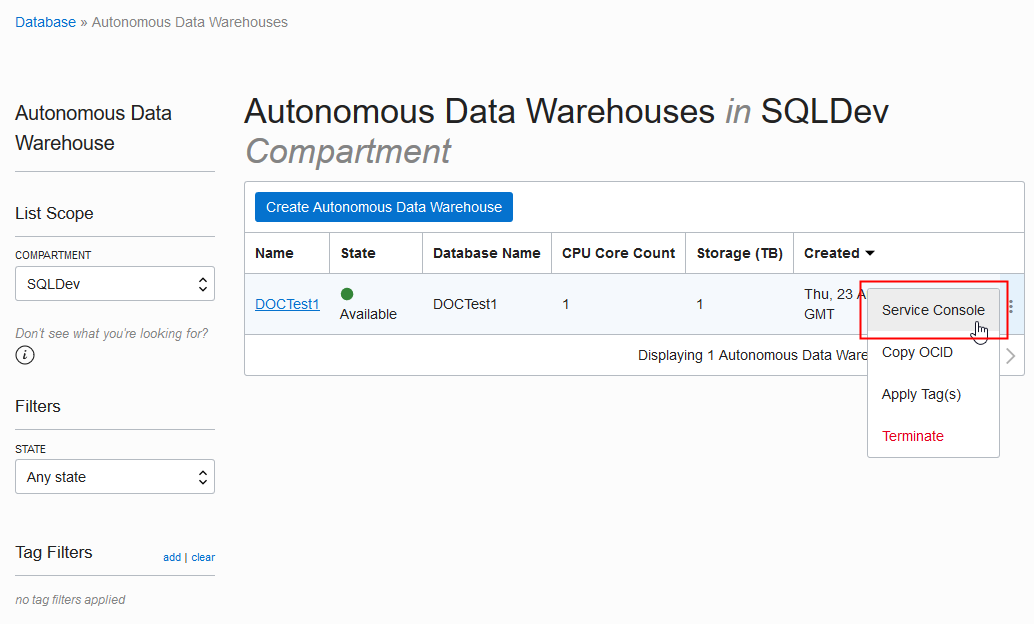
Oracle Autonomous Data Warehouse is designed to streamline data management processes, providing an efficient and automated platform for your analytics needs. As the industry’s first self-driving database, it runs natively on Oracle Cloud Infrastructure (OCI), automating tasks such as patching, provisioning, tuning, and scaling without the need for human intervention. This platform is particularly suited for enterprises looking to manage vast amounts of data with minimal manual effort, offering high performance and scalability.
You can benefit from its ability to integrate with various cloud environments, including AWS, Azure, and Google Cloud, providing expansive multicloud functionality. The platform supports real-time analytics and advanced machine learning models through its built-in Oracle Machine Learning services, which accelerate model creation and deployment. Additionally, Oracle Autonomous Data Warehouse’s Exadata infrastructure offers high-performance storage at reduced costs, making it a cost-effective solution for large-scale data operations.
Ideal for businesses that need to consolidate data from multiple sources into a single, query-optimized data store, Oracle Autonomous Data Warehouse provides robust support for data integration and analysis. With features like automatic data preparation, AutoML for automated model development, and graph analytics for managing complex data relationships, this platform enhances your ability to derive meaningful insights from your data. For organizations looking to modernize their data architecture and improve data accessibility and performance, Oracle Autonomous Data Warehouse is a powerful choice.
In-database machine learning: Offers in-database machine learning capabilities, allowing users to build and deploy models without moving data.
Natural language queries: Enables natural language querying with AI, letting users interact with data without needing SQL knowledge.
Vector search: Supports vector search for identifying similar data across documents, images, and other unstructured data types.
Graph analytics: Includes advanced graph analytics features for uncovering relationships within complex data sets.
Spatial features: Provides comprehensive spatial data processing for large-scale location intelligence and geospatial applications.
Automated threat detection: Uses AI-driven automated threat detection and remediation to enhance data security.
- Compute Costs (ECPU Billing Model):
- Serverless:
- ECPU per hour: Pricing starts at approximately $0.1125 per ECPU hour.
- Dedicated Infrastructure:
- Exadata Storage per ECPU: Costs vary based on the specific configuration and usage, typically higher than serverless options.
- Serverless:
- Storage Costs:
- Serverless:
- Database Storage: Charged per terabyte (TB) per month.
- Backup Storage: Charged separately per terabyte (TB) per month.
- Dedicated Infrastructure:
- Database Storage and Backup Storage: Provisioned in TB increments, with specific pricing based on configuration.
- Serverless:
- Minimum Term:
- For dedicated infrastructure deployments, the minimum subscription term is 48 hours.
Additional Notes:
- BYOL (Bring Your Own License): Users with existing Oracle licenses can benefit from reduced pricing under the BYOL model.
- Cost Estimator Tool: Oracle provides an online cost estimator tool to help users calculate their expected monthly expenses based on their specific usage requirements.
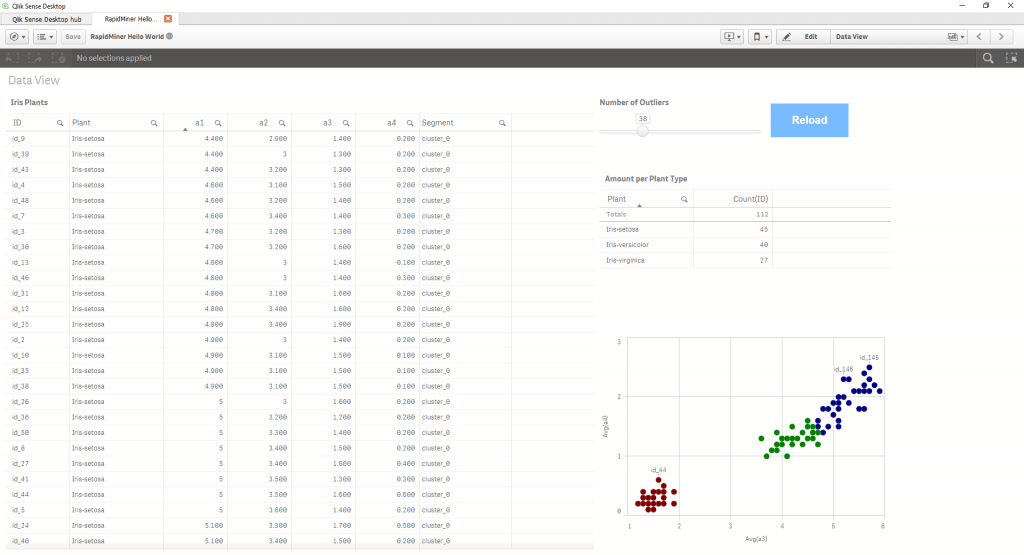
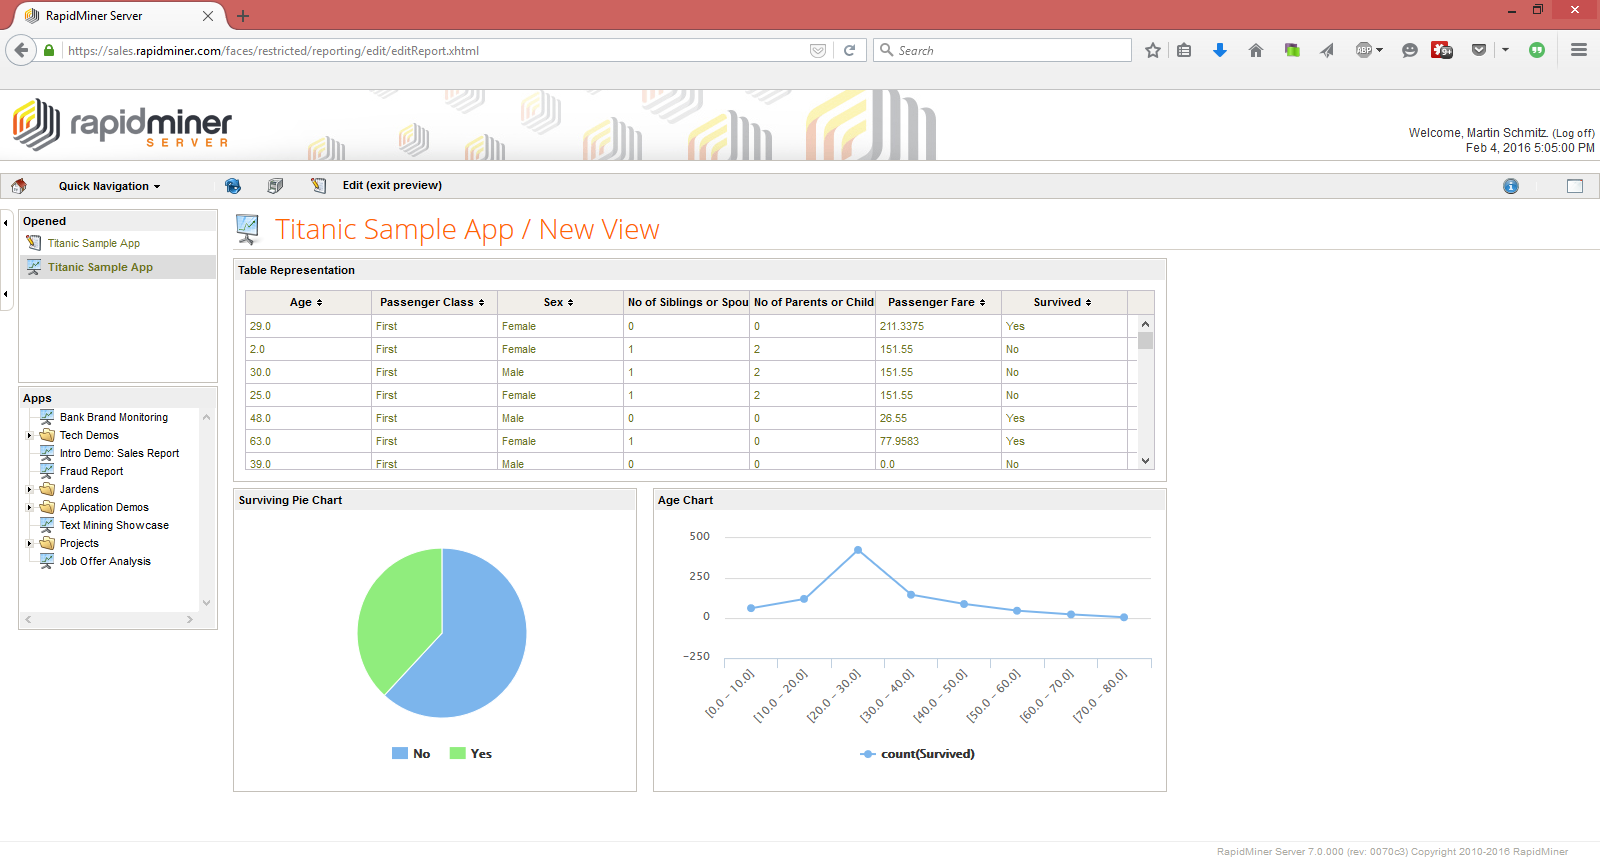
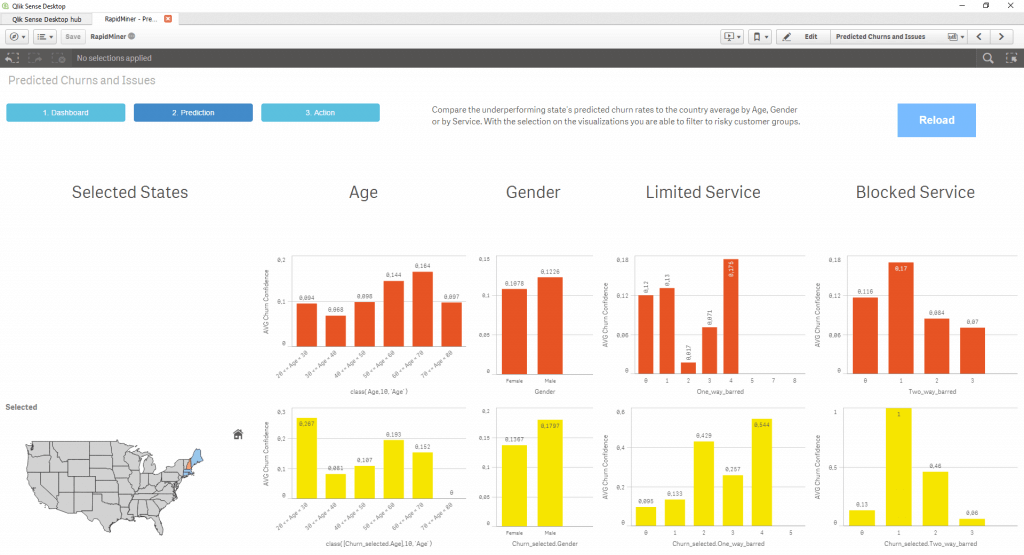
RapidMiner Studio: Best for data mining and aggregation
Overall Score
4.18/5
Pricing
2.5/5
General features and interface
3.9/5
Core features
5/5
Advanced features
4.5/5
Integration and compatibility
5/5
UX
4/5
Pros
- Excellent data processing capabilities
- Model validation mechanisms
- Parallel processing support
Cons
- Scripting limitations
- Memory consumption
- Complex advanced features may be overwhelming for learners
Why we chose RapidMiner Studio
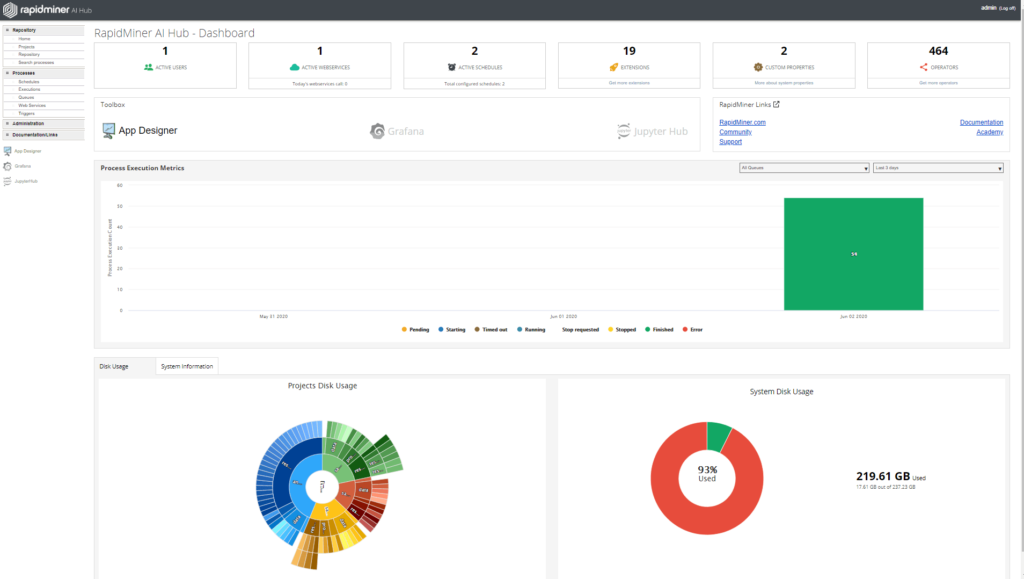
The most compelling attribute of RapidMiner Studio is the level of nuance it provides during data discovery. ETL processes can be defined with numerous granular modifications, making the process of importing and scrubbing data a lot easier. Even messy, unstructured, or poorly organized data can be quickly parsed and processed once the correct automations are in place.
Data almost always has value, but for humans to leverage it meaningfully, it needs to be formatted in a comprehensible way for both users and AI tools. This is RapidMiner’s strong suit: transforming convoluted piles of information into visualizations, dashboards, and prescriptive insights.
KNIME also offers powerful data integration and manipulation capabilities but often requires more manual configuration and coding knowledge. RapidMiner provides a more user-friendly interface and automation features that streamline the ETL process, making it accessible to users with varying levels of technical expertise. Additionally, RapidMiner’s support for handling unstructured data and its ability to produce actionable insights swiftly make it the preferred choice for organizations focused on efficient data mining and aggregation.
RapidMiner Studio is a premier platform for data mining and predictive analytics. It is suitable for both data scientists and business users, offering extensive tools for data preparation, model building, and validation.
If your organization needs to perform advanced data analysis and predictive modeling, RapidMiner’s integration capabilities with various data sources and third-party applications enhance its versatility. The platform’s collaborative features allow your teams to share workflows and insights effectively, driving better business outcomes.
Automated data science: Simplifies complex data transformation, model selection, and validation tasks.
Multi-threaded execution: Capitalizing on your machine’s computational capabilities, RapidMiner offers multi-threaded execution for faster data processing and model building.
Rich data preprocessing tools: Provides a vast range of preprocessing operators, allowing users to clean, transform, and enrich their data efficiently.
Predictive modeling: Supports numerous machine learning algorithms, enabling users to create advanced predictive models.
Visual workflow designer: Drag-and-drop visual interface lets users design complex data workflows with ease, minimizing the need for code.
Professional: $7,500/user/month
Enterprise: $15,000/user/month
AI Hub: $54,000/user/month
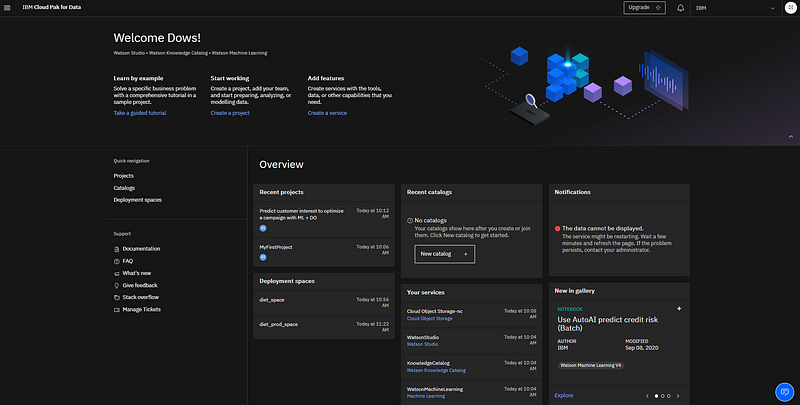
IBM Decision Optimization: Best for machine learning
Overall Score
4.1/5
Pricing
2.1/5
General features and interface
4.5/5
Core features
5/5
Advanced features
5/5
Integration and compatibility
4.4/5
UX
3.8/5
Pros
- Advanced optimization algorithms
- Integration with machine learning
- Scalability
- Customizable models
Cons
- Limited documentation
- Inflexible licensing
- Requires expertise
Why we chose IBM Decision Optimization
IBM has been a major player in computer technologies for decades, having transitioned from producing hardware to developing cutting-edge machine learning systems. Their expertise in this area has placed them at the forefront of business intelligence and prescriptive analytics. While IBM Watson often receives the most attention, IBM Decision Optimization is an equally impressive suite of BI tools that enable large-scale enterprises to transform their operational data into powerful optimization solutions. It is part of IBM’s extensive suite of business intelligence tools.
Alteryx is a very similar competitor, also offering strong data preparation and predictive analytics but lacking the sophisticated optimization capabilities that IBM provides. A key differentiator is IBM’s use of CPLEX solvers, which allow for complex, large-scale optimization problems to be solved efficiently—a feature Alteryx does not offer.
IBM also has the advantage of offering seamless integration with Watson Studio. This gives you direct utilization of machine learning models within optimization workflows, providing a streamlined, high-performance solution for real-time data processing and scenario planning. Alteryx, while strong in its domain, requires more manual effort to combine predictive and prescriptive analytics, limiting its efficiency in handling complex optimization scenarios.
With IBM Decision Optimization, you can tackle complex operational challenges across various sectors, from supply chain management to resource allocation.
Leveraging advanced algorithms and CPLEX solvers integrated with IBM Cloud Pak for Data, this platform turns intricate data sets into actionable insights. If you run a large enterprise that requires sophisticated scenario analysis and what-if modeling to optimize your operations, IBM Decision Optimization is especially beneficial. By integrating with IBM Watson Studio, you can merge machine learning models with optimization techniques, enhancing your operational efficiency and accuracy.
Also read: Reporting Tools Software Guide 2024
Prescriptive analytics: Uses mathematical and computational sciences to suggest decision options to advantage businesses.
Mixed-integer programming (MIP): Enables users to model and solve problems where the decision variables are a mix of continuous and integer variables.
Constraint programming: Helps solve complex combinatorial problems by specifying the constraints that need to be satisfied.
Heuristic methods: For complex problems where exact methods might be too slow, IBM Decision Optimization provides fast, high-quality heuristic solutions.
Scenario analysis: Allows businesses to consider a range of outcomes and conditions for multiple scenarios to better manage risks and uncertainties.
IBM ILOG CPLEX Optimization Studio:
- Free Edition: Available for academic use.
- Developer Subscription: Priced at $199 per authorized user annually (TrustRadius) (Top AI Tools Directory – OpenTools).
IBM Decision Optimization for Watson Studio:
- Contact for Pricing: Custom pricing is available based on enterprise requirements and deployment scale (GptDemo).
IBM Cloud Pak for Data:
- On-Demand Pricing: Starts at $0.56 per capacity unit hour, with additional costs for storage and data transfer.
- Subscription Pricing: Annual subscriptions are available at a custom quoted price.
KNIME: Best for data science flexibility on a budget
Overall Score
4.11/5
Pricing
3.3/5
General features and interface
3.9/5
Core features
3.5/5
Advanced features
5/5
Integration and compatibility
5/5
UX
3.5/5
Pros
- Open source
- Extensive integration options
- Extensive analytics capabilities
- Strong community support
Cons
- Resource-intensive workflows
- Limited in-built visualizations
- Complex deployment
Why we chose KNIME
While KNIME lacks the sleek, push-button UIs that most other BI tools present, this isn’t necessarily a drawback, depending on the use case. For those in need of high levels of customization and the ability to shape the models and learning algorithms to their data pipelines, workflows, and native environments, KNIME has a lot to offer.
Additionally, KNIME is free to use for individual users, and its more DIY structure facilitates lower costs than other solutions when adding to the user base. KNIME’s “data sandbox” is perfect for data teams that want to supercharge their efforts but don’t need to offer widespread end-user access to the tools themselves.
When compared to RapidMiner Studio, another competitor known for its strong data mining and aggregation capabilities, KNIME wins in the categories of flexibility and cost-effectiveness. RapidMiner offers a more guided experience with its automation features, but this comes at a higher price point and with less customization. KNIME, in contrast, provides a more open environment where data scientists can build highly tailored workflows without being constrained by pre-built processes.
KNIME (Konstanz Information Miner) provides a highly customizable environment for your data analytics needs, catering to data scientists and analysts who require granular control over their workflows.
Its modular design allows you to build data processes using a variety of nodes for tasks like data preprocessing and machine learning. KNIME’s open-source nature makes it accessible to individual users at no cost, with additional enterprise features available for larger teams. If you prioritize flexibility and innovation in your data science projects, KNIME offers a sandbox environment perfect for experimenting with different models and algorithms.
Also read: Best Data Analysis Software & Tools for 2024
Visual workflow editor: Provides an intuitive, drag-and-drop style visual interface for building data workflows. This makes the process of data manipulation, analysis, and visualization easy to understand and execute.
Extensive integration capabilities: Supports a wide range of data formats and systems, including SQL, NoSQL, Hadoop, and various cloud storage options, enabling seamless data integration from diverse sources.
Open source and customizable: Offers the flexibility to customize the platform according to specific needs. Users can contribute new functionalities via KNIME’s node extension system.
Rich analytics tools: Houses a comprehensive set of tools for data mining and machine learning algorithms, statistical functions, and data visualization, serving as a robust platform for data-driven decision-making.
Contact KNIME for a customized quote.
Prescriptive analytics
A quick breakdown of the four common functions of business intelligence:
| Descriptive Analytics | The “What” | Used to organize data, parse it, and visualize it to identify trends. |
| Diagnostic Analytics | The “Why” | Used to analyze trends, examine their progress over time, and establish causality. |
| Predictive Analytics | The “When” | Used to compile trend and causality data, and extrapolate upcoming changes to anticipate outcomes. |
| Prescriptive Analytics | The “How” | Used to predict possible scenarios, test possible strategies for ROI or loss potential, and recommend actions. |
Prescriptive analytics is among the most advanced business applications for machine learning and data science. It requires a significant amount of AI processing and depends on large volumes of reliable data. More importantly, like a human employee, it can be trained to respond to inputs and scenarios over time, improving the recommendations it outputs.
Recent studies, such as this one published in the International Journal of Management Information Systems and Data Science, highlight the transformative impact of integrating machine learning with prescriptive analytics to enhance business decision-making processes and competitive advantage.
For a deeper dive on prescriptive analytics and where it fits into the data analysis ecosystem, check out this article on data analysis software.
Read more: What is Diagnostic Analytics?
“Always tell me the odds”: Why prescriptive analytics matter
Prescriptive analytics isn’t a crystal ball. What it is might be closer in analogy to an independent consultant or a military tactician. It surveys the battlefield and considers numerous scenarios based on likelihood, parameters and circumstantial constraints, intensity of effects on final outcomes, and the options or resources available to the organization.
Then, after simulating the possibilities and comparing current plans to potential alternatives, it makes recommendations to promote the most positive results.
In short, it doesn’t remove the uncertainty from business planning; it reduces the level of disruption caused by unanticipated events or a lack of forethought.
Forecasting outcomes like this can be used to achieve a number of important business goals:
- Preventing or mitigating loss
- Minimizing or avoiding risk factors
- Optimizing processes, schedules, and routes
- Improving resource utilization and limiting downtime
- Anticipating opportunities
With prescriptive analytics, businesses can work proactively, instead of reactively. It’s reassurance and validation when things go according to plan, and it’s a safety net when things take a turn for the catastrophic. Either way, you’ve explored the possibilities via numerous scenarios and simulations, and you’re as prepared as possible for what the future brings.
Choosing the best prescriptive analytics software
Remember, “crazy prepared” is only a negative until everyone needs what you’ve prepared in advance. Hopefully, this list of prescriptive analytics tools will help you find the solution that positions your business as the Batman of your industry. If not, check out our in-depth embedded analytics guide for more insight on how to choose a provider for your use case.
Looking for the latest in Business Intelligence solutions? Check out our Business Intelligence Software Buyer’s Guide.