Data analytics might be the closest thing we have to fortune telling in modern business, and a quality embedded analytics tool can give your company a powerful edge. Organizations look to statistical trends to anticipate future outcomes and prepare for them.
Business intelligence (BI) tools are the answer. We look to these software-as-a-service (SaaS) tools to help us turn the noisy data into something from which we can learn and benefit. The good news is, many of these tools give us a glimpse into the future via embedded analytics.
Top embedded analytics tools
- Microsoft Power BI: Best for security/compliance
- Qlik Sense: Best for customizable integrations
- Powered by Looker: Best for data modeling
- Tableau: Best for data visualization
- Domo Everywhere: Best for simplicity
- Dundas BI: Best for multiple businesses
ALSO READ: What is Embedded Analytics?
Featured partners

Tableau: Best for data visualization
Overall Score
4.34/5
Pros
- Interactive and intuitive dashboards
- Advanced analytics functionality
- Powerful data visualization
- User-friendly interface
Cons
- Salesforce integration focus
- Additional cost for add-ons
Why I picked Tableau
Tableau stands out for its highly intuitive design and visualization capabilities, enabling users to transform data into detailed, visually engaging dashboards without complex coding skills. Its drag-and-drop interface remains one of the most accessible among BI tools, empowering users at any skill level to explore data and create powerful visualizations quickly.
Compared to other tools like Microsoft Power BI, which excels in security and compliance, Tableau offers unmatched flexibility in designing intricate visualizations, ideal for teams needing detailed and customizable data presentations. While Qlik Sense provides deep integration flexibility, Tableau’s strength lies in its sophisticated visual design and analytics, often making it the preferred choice for organizations prioritizing visual exploration. This, combined with its ability to handle large data volumes, positions Tableau as a top solution for companies seeking impactful, real-time data insights with minimal learning hurdles.
True to its brand name, Tableau offers some of the smoothest, most aesthetically pleasing analytics options from the perspective of end users. Built with external embedded implementations in mind, Tableau can power a web page, web portal, or external-facing app with equal ease and simplicity.
The tool can be white labeled, further indicating its intended use as the analytics engine for apps built by different brands.
As for external users, they get a variety of customization options, all with minimal complexity. Most visualizations can be created and edited with drag-and-drop tools, so users can focus on the key performance indicators (KPIs) they benefit from most.
Informative dashboards: Tableau Dashboards combine various visual objects, images, and text to offer a comprehensive view of data.
Supports numerous data sources: Tableau can connect to a vast array of data sources, from local files to cloud data, and supports various data connections like Google Analytics, Salesforce, and SQL Server.
Connectivity with live and in-memory data
Provides great security: The platform emphasizes data and user security with authentication and authorization mechanisms, integration with other security protocols, and features like row-level filtering.
Easy collaboration, sharing, and real-time feedback
Excellent mobile Version
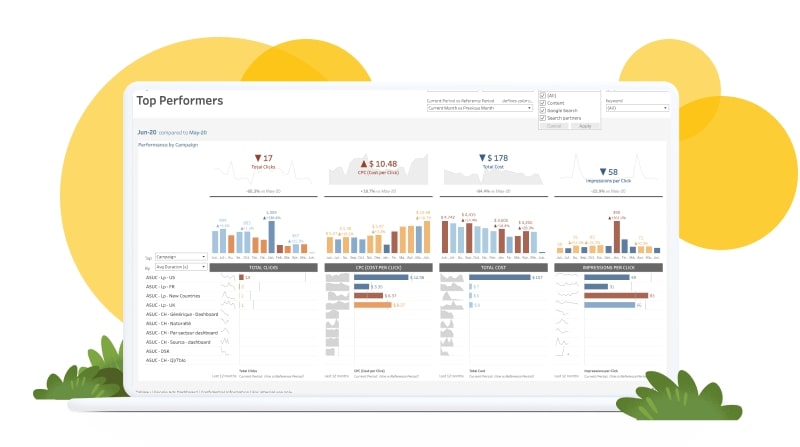


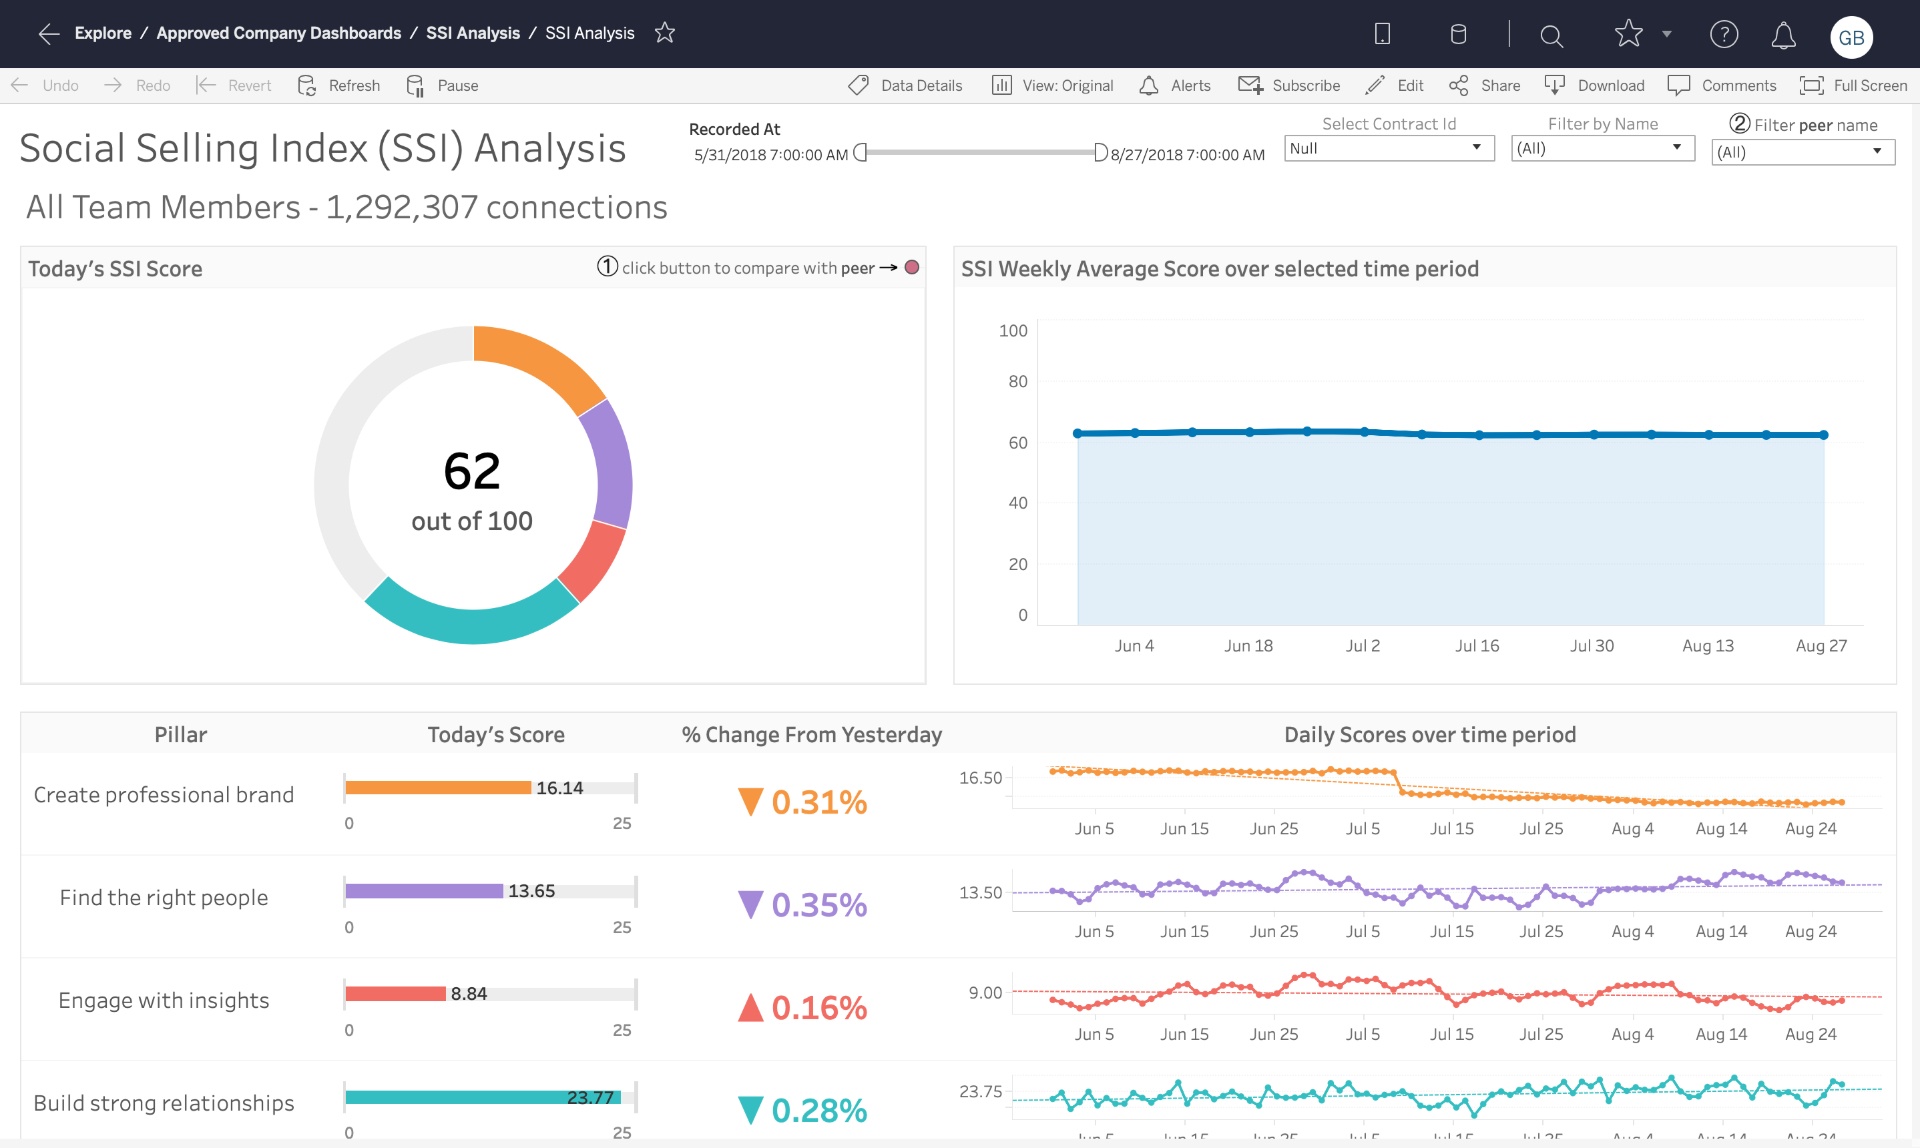
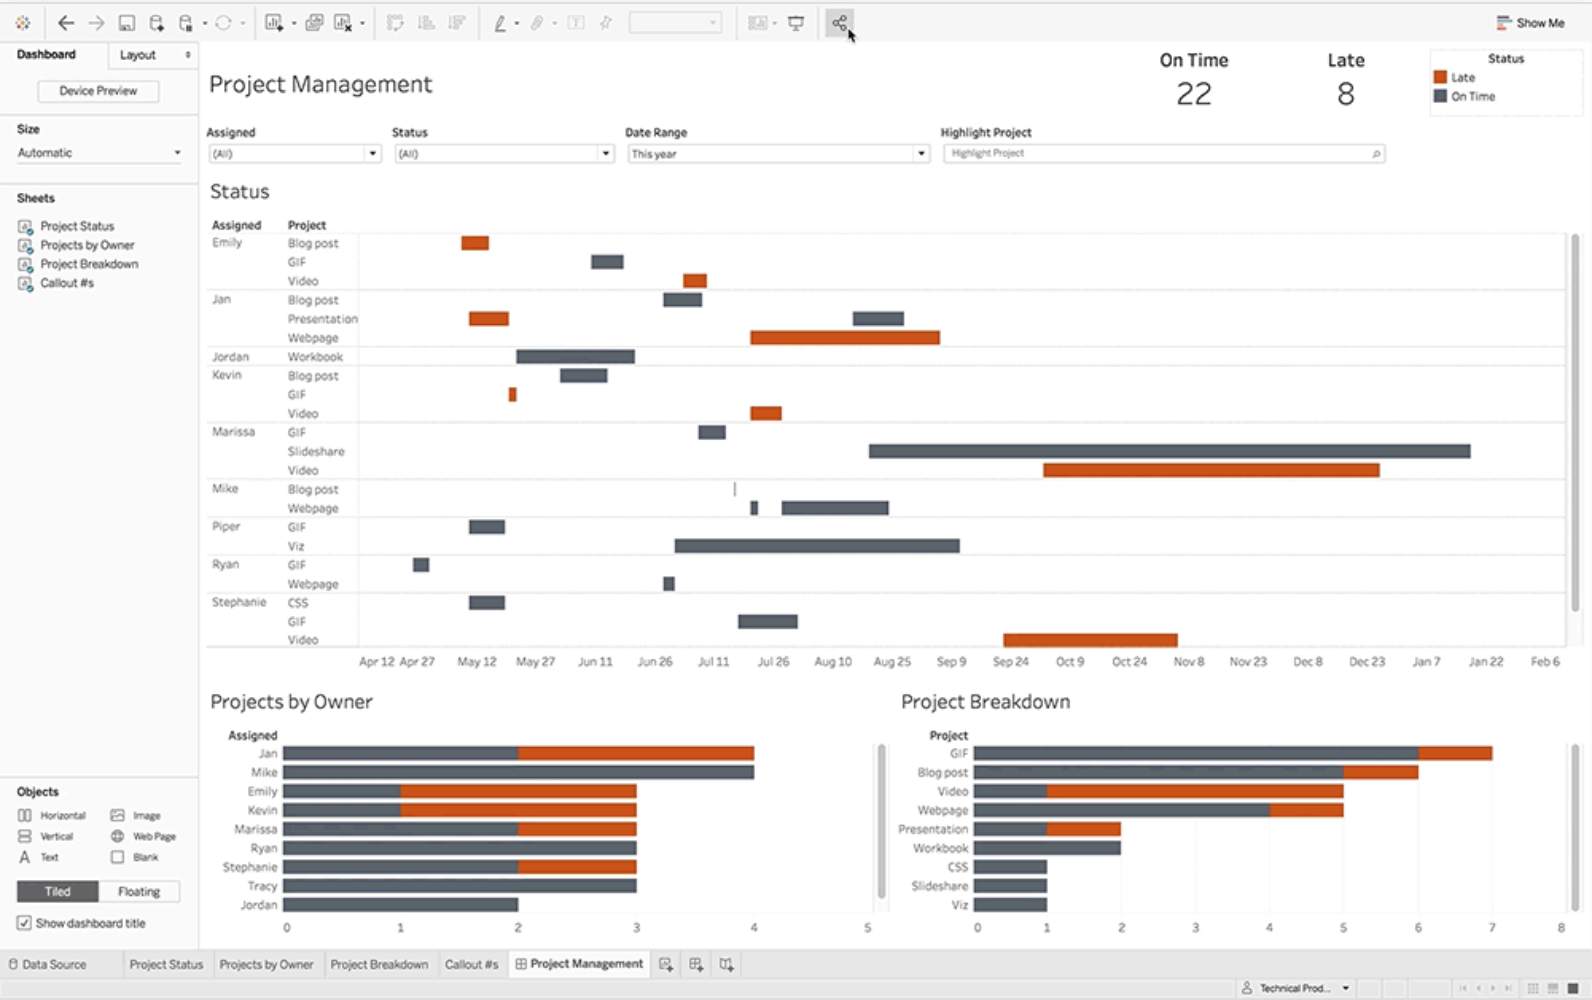
Tableau Viewer: $15/user/month
Tableau Explorer: $40/user/month
Tableau Creator: $70/user/month

Microsoft Power BI: Best for security/compliance
Overall Score
4.26/5
Pros
- Seamless integration with Microsoft suite
- Regular updates
- Extensive data visualization options
- Cloud integration
Cons
- Pipeline and DAX complexity
- Custom visual setup complexity
- Feature overload
Why I picked Microsoft Power BI
Microsoft Power BI remains a top choice for organizations prioritizing security and compliance in their embedded analytics solutions. With robust adherence to standards like ISO 27001, SOC, and GDPR, Power BI is a step ahead of competitors like Tableau and Domo Everywhere in offering built-in protections critical for regulated industries and data-sensitive environments.
A key differentiator for Power BI is its seamless integration with Azure Active Directory for granular access management, allowing businesses to control who sees specific datasets easily. This feature is ideal for companies needing secure, scalable permissions management—a level of security customization that many other tools on this list, like Looker or Dundas BI, don’t match as extensively.
In addition to these controls, Power BI’s end-to-end data encryption ensures that sensitive data remains secure both in storage and in transit, making it a favored solution for teams requiring stringent data protection without compromising on insightful, powerful analytics.
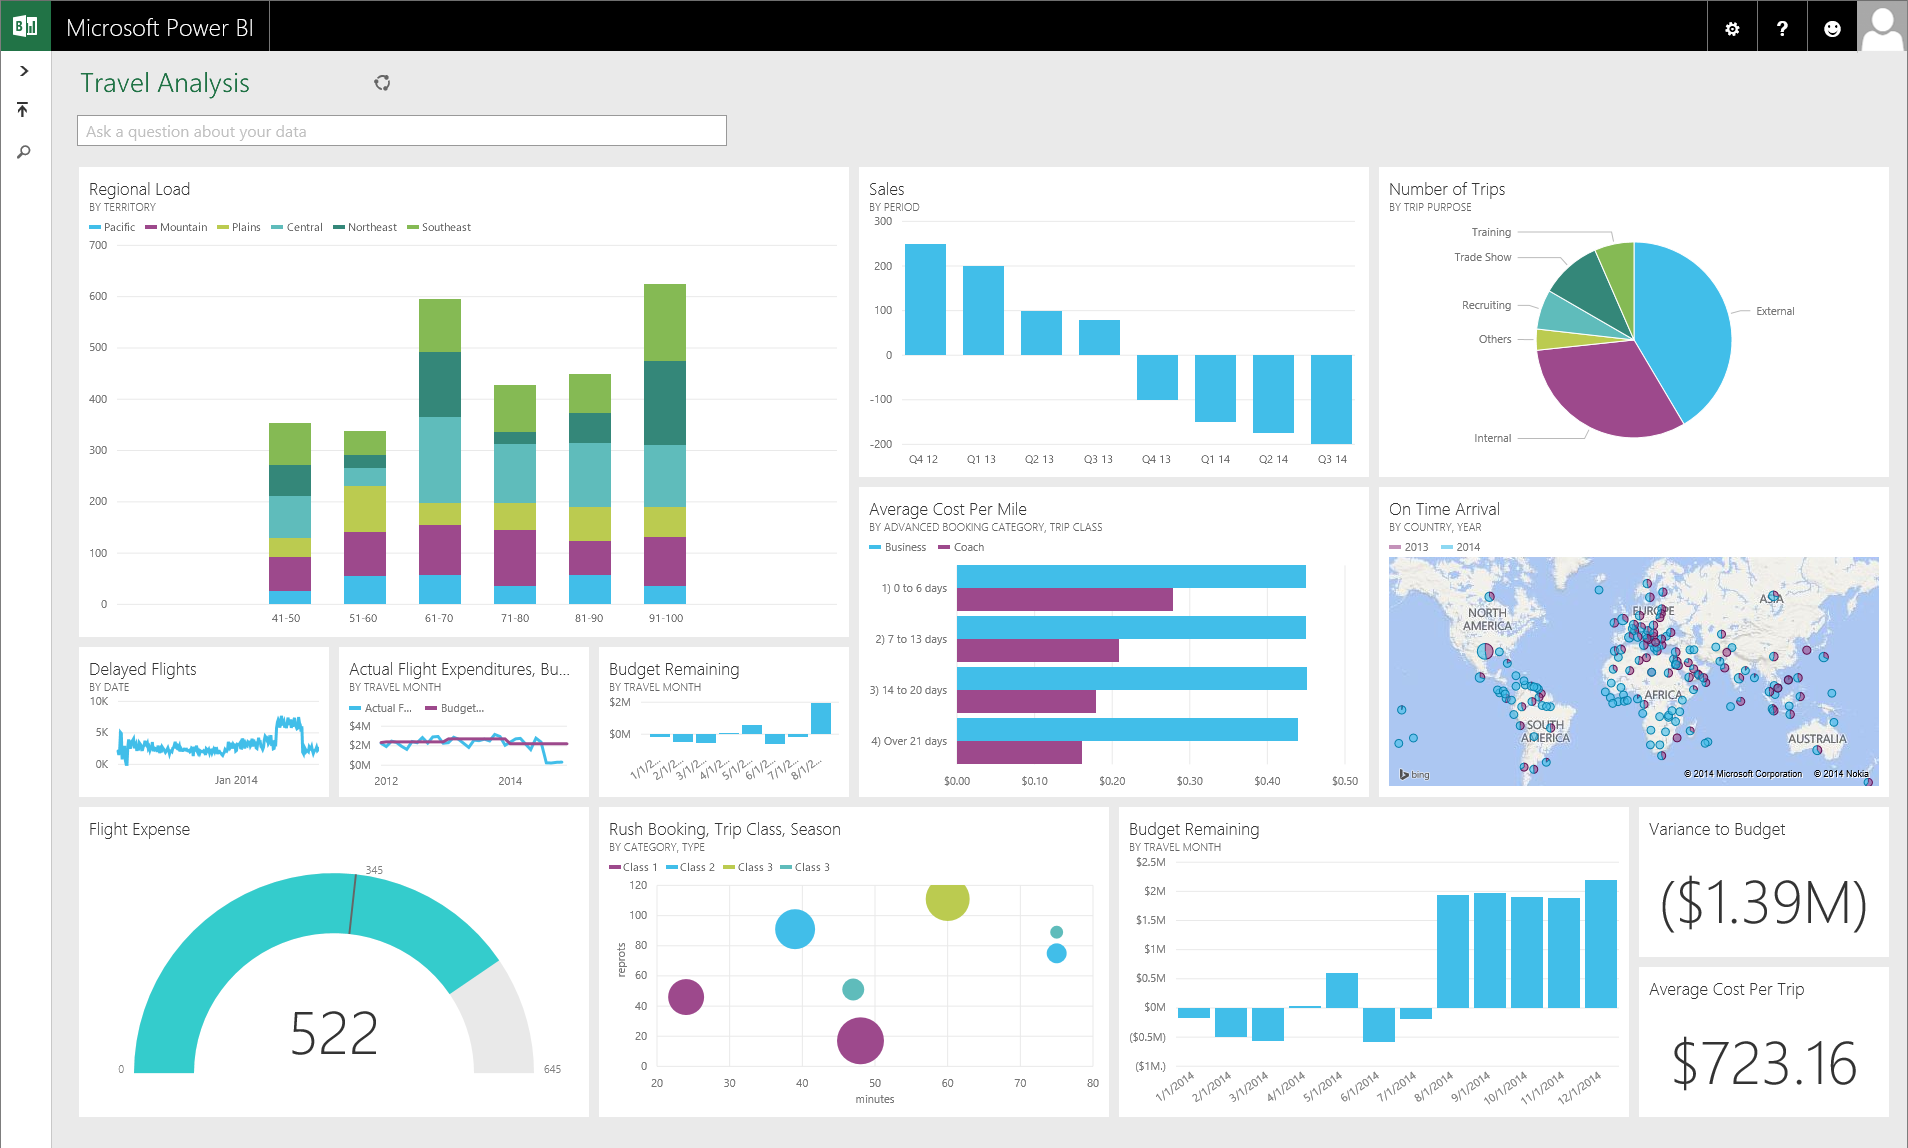
We’ll start with Microsoft’s proprietary solution: Power BI. Because it’s built by Microsoft, it offers all of the same business-focused cybersecurity features as other Microsoft products. Organizations that choose to use Office 365 for improved file security, for example, will likely find a lot to love about Power BI, especially internal use.
Power BI also features an “analytics playground,” where functionality and features can be test driven, and where updates can be previewed ahead of full deployment.
White-Labeling Capabilities: Power BI Embedded allows businesses to white-label its analytics, enabling them to provide customer-facing dashboards and analytics within their applications without revealing the underlying technology.
Integration with Microsoft Azure: Power BI integrates seamlessly with Azure services, enhancing data processing and analytics capabilities.
Row-Level Security: Data can be filtered and restricted at the row level based on user roles or other criteria, ensuring sensitive information is accessible only to authorized users.
Monitoring and Automation with REST APIs: Power BI provides REST APIs for monitoring and automating various tasks, facilitating efficient management and deployment of analytics solutions.
Investment in Cybersecurity: Microsoft’s significant annual investment in cybersecurity research and development ensures Power BI benefits from the latest security advancements and best practices.
Dedicated Security Experts: Microsoft employs over 3,500 security experts dedicated to data security and privacy, reinforcing Power BI’s commitment to protecting user data.


Power BI Pro: $9.99/user/month
Power BI Premium: $20/user/month OR $4,995/capacity/month
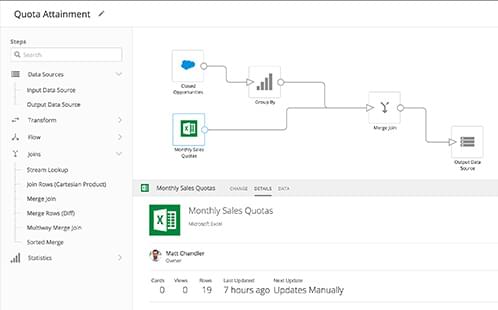
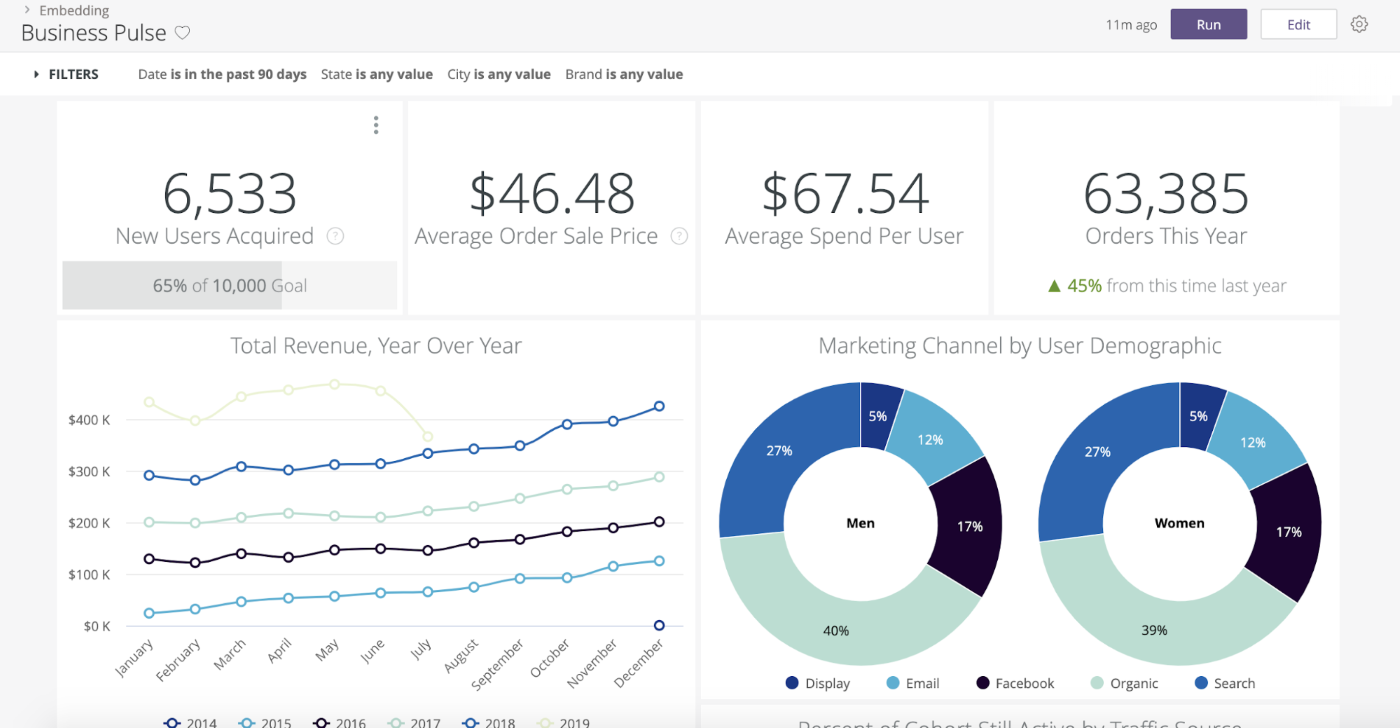
Domo Everywhere: Best for simplicity
Overall Score
4.5/5
Pros
- Data aggregation from multiple sources
- Extensive data connectors
- ETL capabilities
- Collaboration features
Cons
- Visualization limitations
- Search functionality could be improved
Why I picked Domo Everywhere
Domo Everywhere is a standout solution for businesses that prioritize simplicity and accessibility in embedded analytics. Its user-friendly interface allows even non-technical users to build and share dashboards quickly, removing the intimidation often associated with advanced data tools. This ease of use gives it an edge over more complex platforms like Tableau or Qlik Sense, which may require greater expertise for setup and customization.
Domo’s low learning curve and straightforward deployment make it a top choice for organizations aiming to democratize data access and embed analytics into workflows without technical bottlenecks. While Microsoft Power BI is ideal for companies prioritizing security and compliance, Domo Everywhere is designed for businesses that want fast, intuitive insights with minimal setup. This clarity and ease make Domo Everywhere especially attractive for teams looking to embed analytics without the overhead of extensive training or IT involvement, creating a smoother path to data-driven decisions.
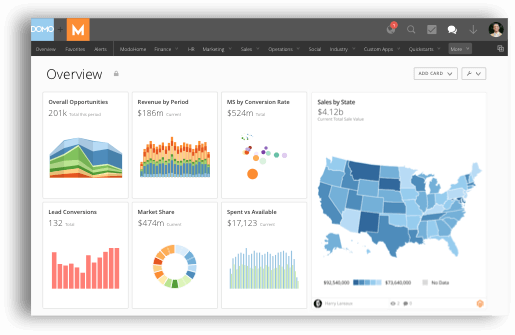
Domo as a stand-alone business intelligence solution has been available for a while, but its embedded version, Domo Everywhere, is a bit more recent. Don’t expect a heavily pared-down version though, as it still brings a full suite of features to the table.
Like Tableau, Domo Everywhere offers a visually appealing user interface (UI) experience and white label presentation. It also provides external users with a high level of flexibility to build the dashboards and visualizations they want. Almost all of its functionality is self-service, meaning users can adjust and customize as needed, without having to get technical support.
App Creation Tools: Domo provides both low-code and pro-code tools for developing custom business applications, catering to varying technical expertise levels.
Data Integration: The platform connects to over 1,000 data sources, ensuring comprehensive data integration capabilities.
Self-Serve Analytics: Users can independently create reports and set up data alerts for real-time insights, promoting a data-driven culture.
Data Science and Machine Learning: Domo enables building automated models to highlight relevant data and surface actionable insights.
Governance and Security: Features include user permissions, monitoring, built-in certification workflows, and row-level data security, ensuring robust data governance.

Standard: $83 user/month
Professional: $160 user/month
Enterprise: $190 user/month

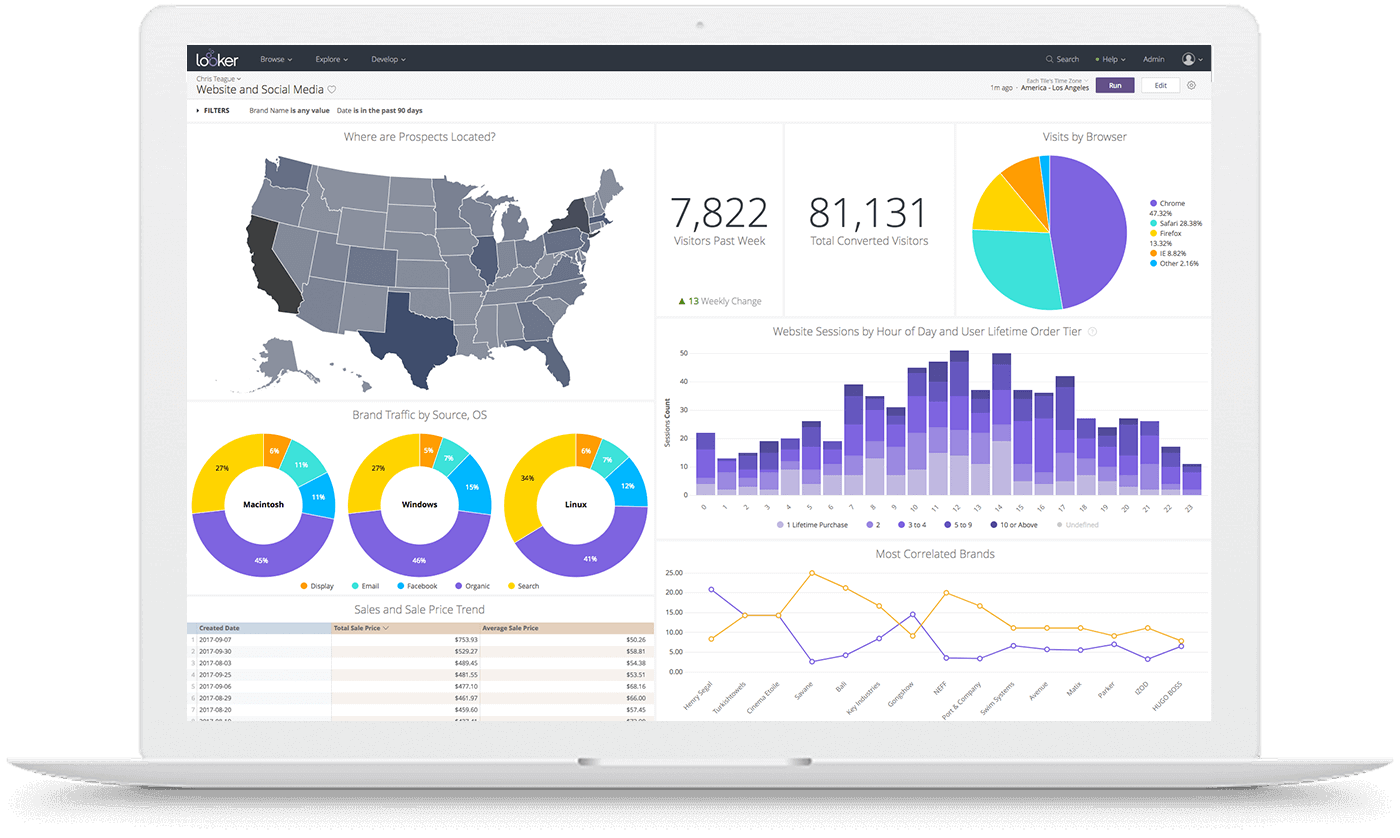
Looker: Best for data modeling
Overall Score
4.16/5
Pros
- Data exploration with LookML
- Extensive API capabilities
- Customizable dashboards
- Version control
Cons
- Steep learning curve
- Complex functionality
Why I picked Looker
Powered by Looker excels in transforming complex data into actionable insights, making it a powerful choice for organizations that prioritize data modeling flexibility. Its proprietary modeling language, LookML, sets it apart from tools like Domo Everywhere and Dundas BI by allowing businesses to define and manage data logic in a centralized, consistent way. This creates a reliable “single source of truth” that teams across the organization can leverage, ensuring data models are reusable, extendable, and tailored to specific business needs.
Compared to Tableau, which is known for its exceptional visualization capabilities, Looker places more emphasis on data consistency and modeling depth, which is particularly valuable for data-driven teams looking to standardize analytics across multiple departments. This approach enables Looker to align data with business logic seamlessly, helping organizations maintain data integrity and focus on strategic insights rather than manual adjustments.
Looker’s data modeling framework is ideal for companies that want structured, scalable insights without sacrificing flexibility—an advantage over solutions that emphasize ease of use over customization.
Powered by Looker is a Google Cloud product that does for BI data lineage what Google Docs did for document editing. It provides a way to track changes and review the history of the database.
The app itself is web-native, and features a web-native interface, regardless of where it’s embedded. This makes it more user friendly to lay professionals. Where it really shines is what it offers data science teams.
LookML: A SQL-based modeling language that centralizes business rule definitions, ensuring consistent and governed data across the organization.
Integration with Looker Studio: Users can connect to Looker’s semantic model and utilize Looker Studio for unified data analysis, enhancing analytical capabilities.
Google Cloud Integration: Built on Google Cloud infrastructure, Looker integrates seamlessly with Google’s suite of services, providing scalability and reliability.
Enterprise-Class Business Intelligence: Looker streamlines the creation of reports and dashboards, facilitating efficient data-driven decision-making.
Real-Time Data Views: The platform offers real-time data exploration, allowing users to access up-to-date information for timely insights.

Starting at $20,000
Contact Google for exact pricing.

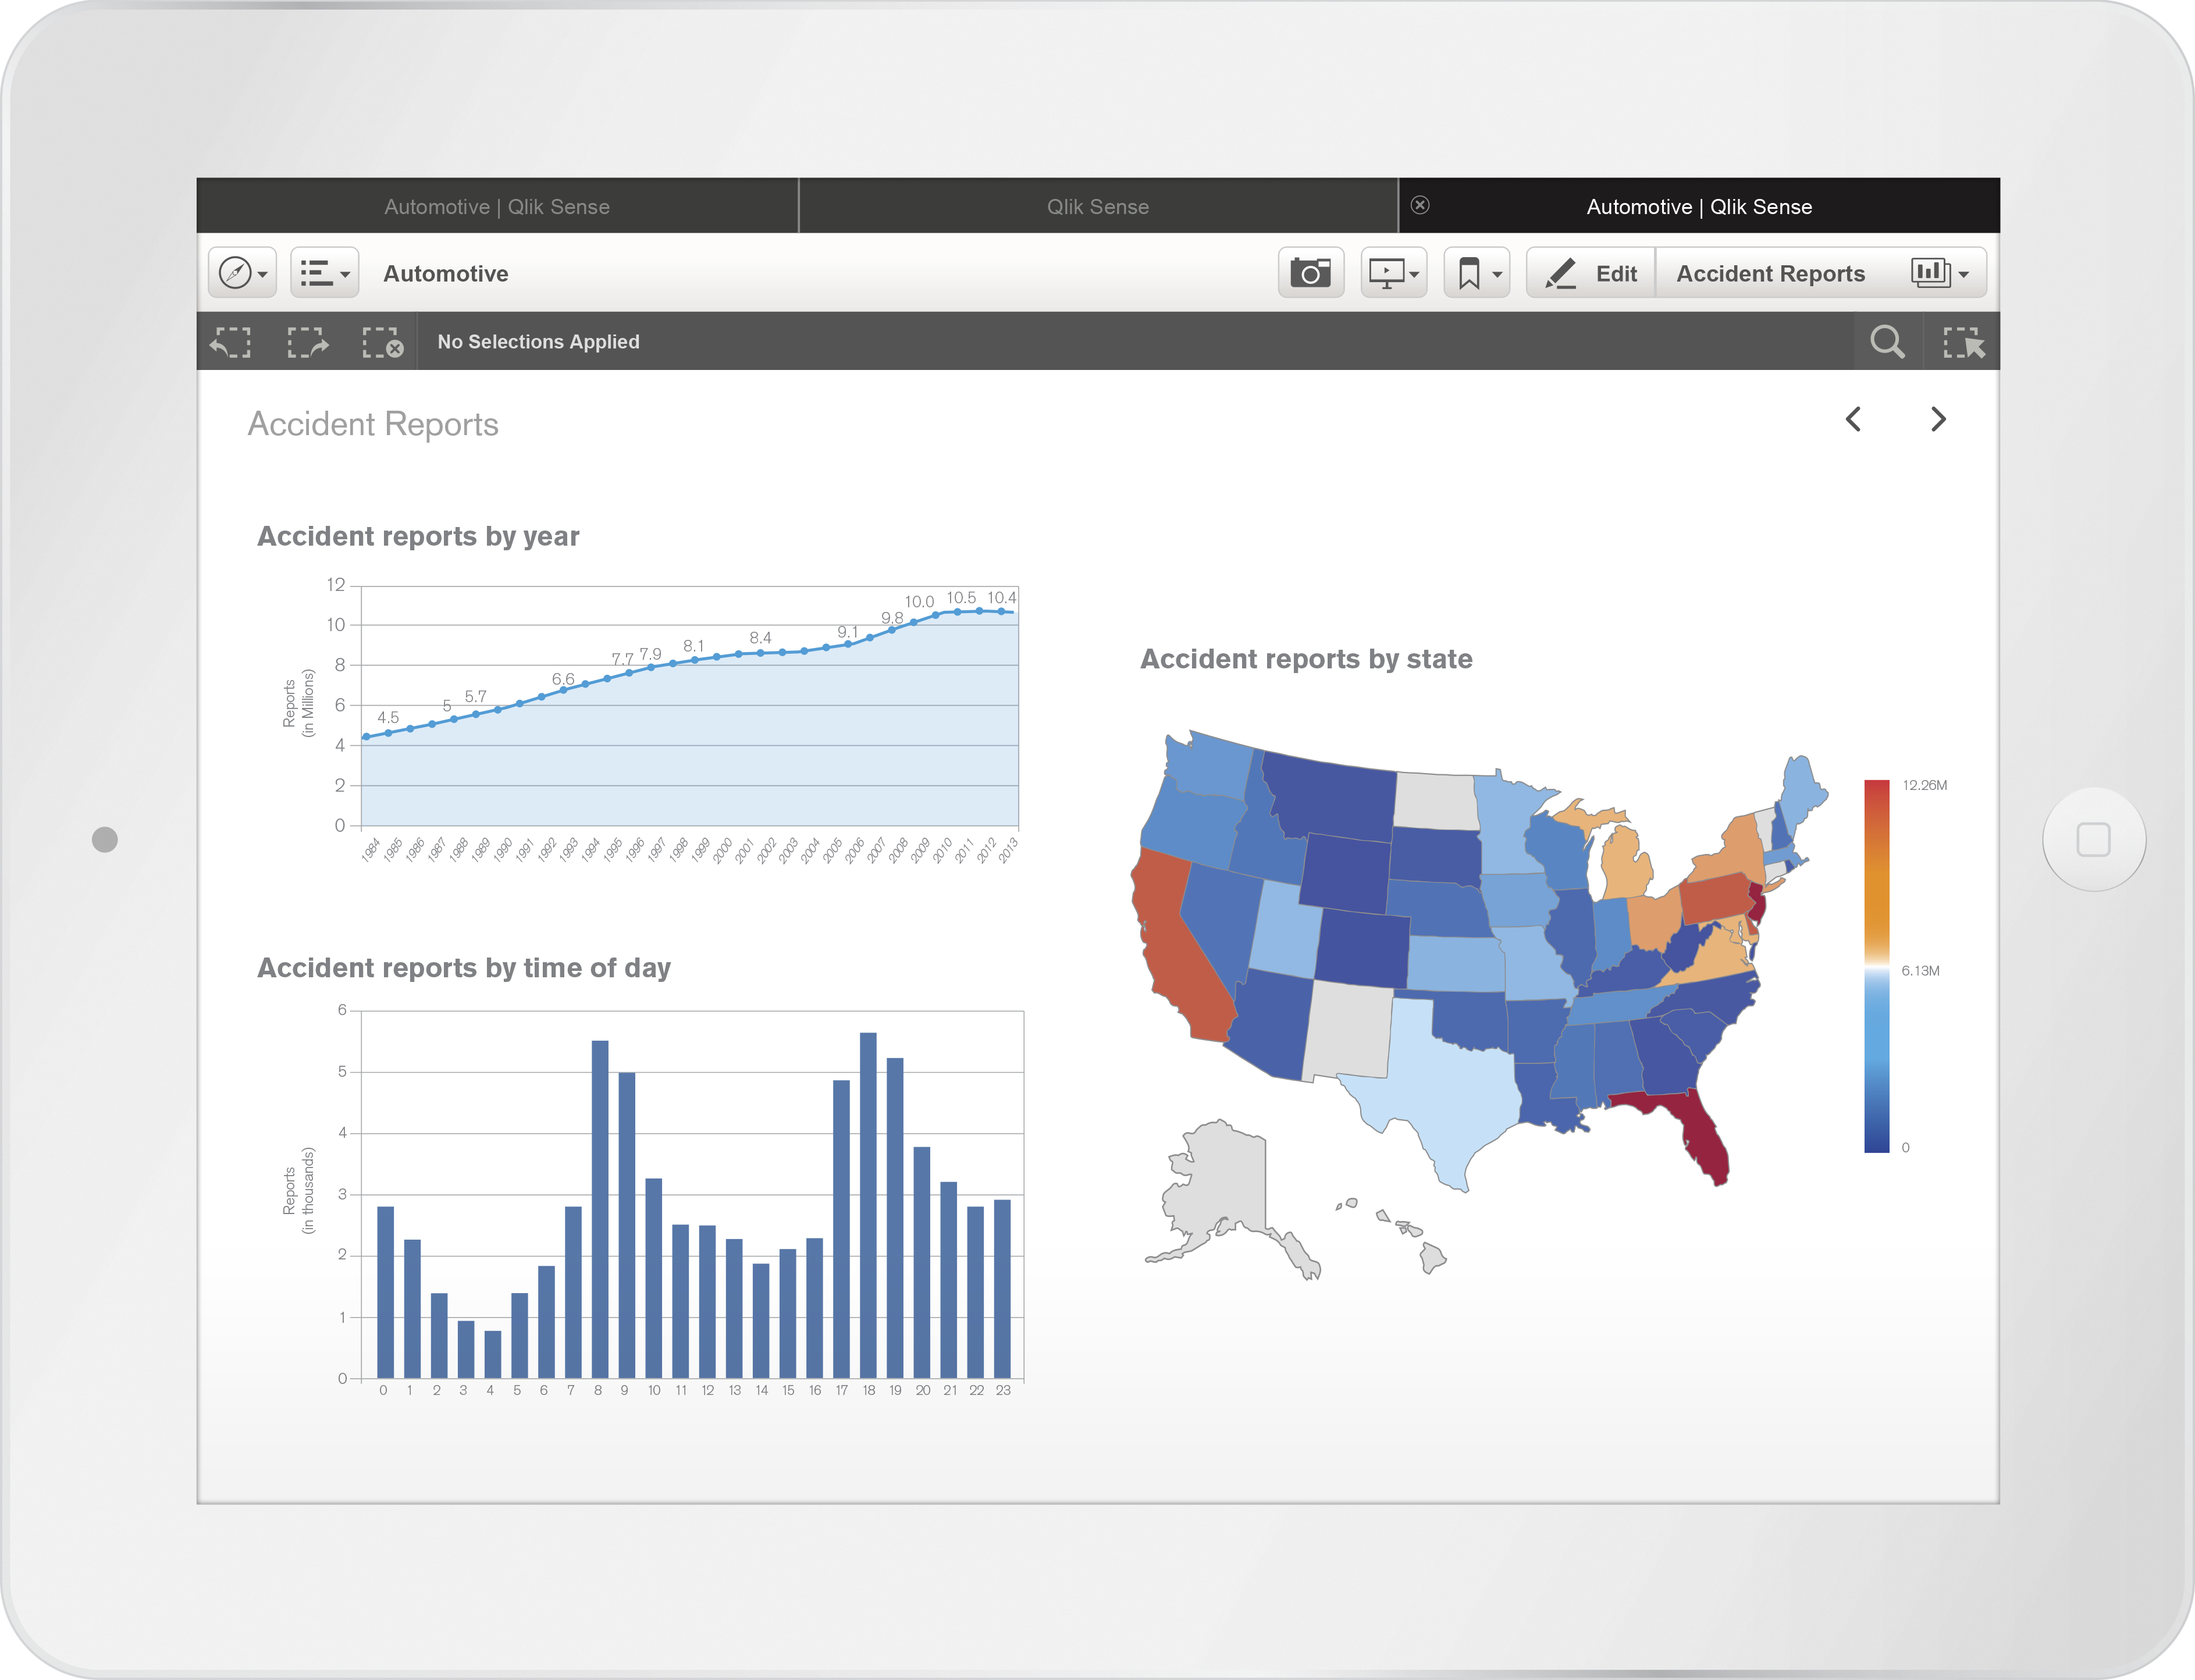
Qlik Sense: Best for customizable integrations
Overall Score
3.99/5
Pros
- Seamless UX across devices
- Extensive integration capabilities
- Robust analytics features
- User-friendly drag-and-drop interface
Cons
- Scalability challenges
- High licensing costs
Why I picked Qlik Sense
Qlik Sense is a top-tier choice for businesses that require extensive customization and integration options in their embedded analytics. With its open APIs and flexibility, Qlik Sense goes beyond the capabilities of tools like Domo Everywhere and Tableau, allowing it to integrate seamlessly into various applications and complex IT environments. This adaptability makes Qlik Sense particularly valuable for organizations that need analytics to be deeply embedded and finely tuned to fit their unique workflows and infrastructure.
Compared to Microsoft Power BI, which is strong in security and compliance, Qlik Sense shines in integration flexibility, providing an unmatched ability to customize and tailor analytics to specific business processes. Its open APIs enable businesses to connect Qlik Sense with proprietary or specialized software solutions, offering a level of customization that many other analytics tools on this list can’t match.
Qlik Sense’s adaptability is a significant advantage for companies that need their analytics tools to be as agile and responsive as their own operations, making it a smart choice for teams focused on personalized, deeply integrated data solutions.
Qlik Sense is heavily focused on providing flexibility and customizability to dev teams who wish to implement it. First and foremost, it supports an open-source library to facilitate easier integrations across a multitude of environments.
It also provides numerous automation options, so product teams can integrate analytics tools directly into their data life cycles. DevOps teams can leverage this to improve their ability to provide seamless user experiences.
Custom and Embedded Analytics: Qlik Sense supports tailored analytics that can be directly embedded into applications or platforms, enhancing integration and user experience.
Integration with Multiple Data Sources: The platform connects to various data sources, enabling comprehensive data analysis and visualization.
High-Performance SaaS and Hybrid Cloud Platform: Qlik Sense on Qlik Cloud offers flexibility with hybrid deployment options across public cloud, private cloud, and on-premises environments.
AI-Powered Analytics: The platform includes AI-generated insights, automated data preparation, and predictive analytics, enhancing decision-making processes.

Free trial available
Qlik Sense Business: $30/user/month
Qlik Sense Enterprise SaaS: Contact Qlik Sense for a customized quote
Dundas BI: Best for multiple businesses
Overall Score
3.84/5
Pros
- Integration with Active Directory and local user accounts
- Exceptional customer support
- Frequent updates and new features
- Intuitive UI
Cons
- Security enhancements needed
- Occasional bugs
Why I picked Dundas BI
Dundas BI is an ideal choice for organizations with multiple business units or diverse client needs, offering robust multi-tenancy support that allows different user groups to access tailored dashboards and reports. This flexibility in user management sets Dundas BI apart from options like Looker and Domo Everywhere, making it especially suited for companies that need to deliver personalized analytics experiences to various internal teams or clients while maintaining centralized control and security.
Dundas BI’s open APIs and customizable design options provide deep integration capabilities, allowing businesses to adjust branding and analytical features to meet the unique needs of each department or client. While Qlik Sense also excels in customization, Dundas BI offers a unique combination of multi-tenancy and design flexibility, ensuring that analytics can be both cohesive and distinct, based on user requirements. This adaptability makes Dundas BI a strong choice for organizations looking to support diverse user needs without sacrificing ease of management or security.
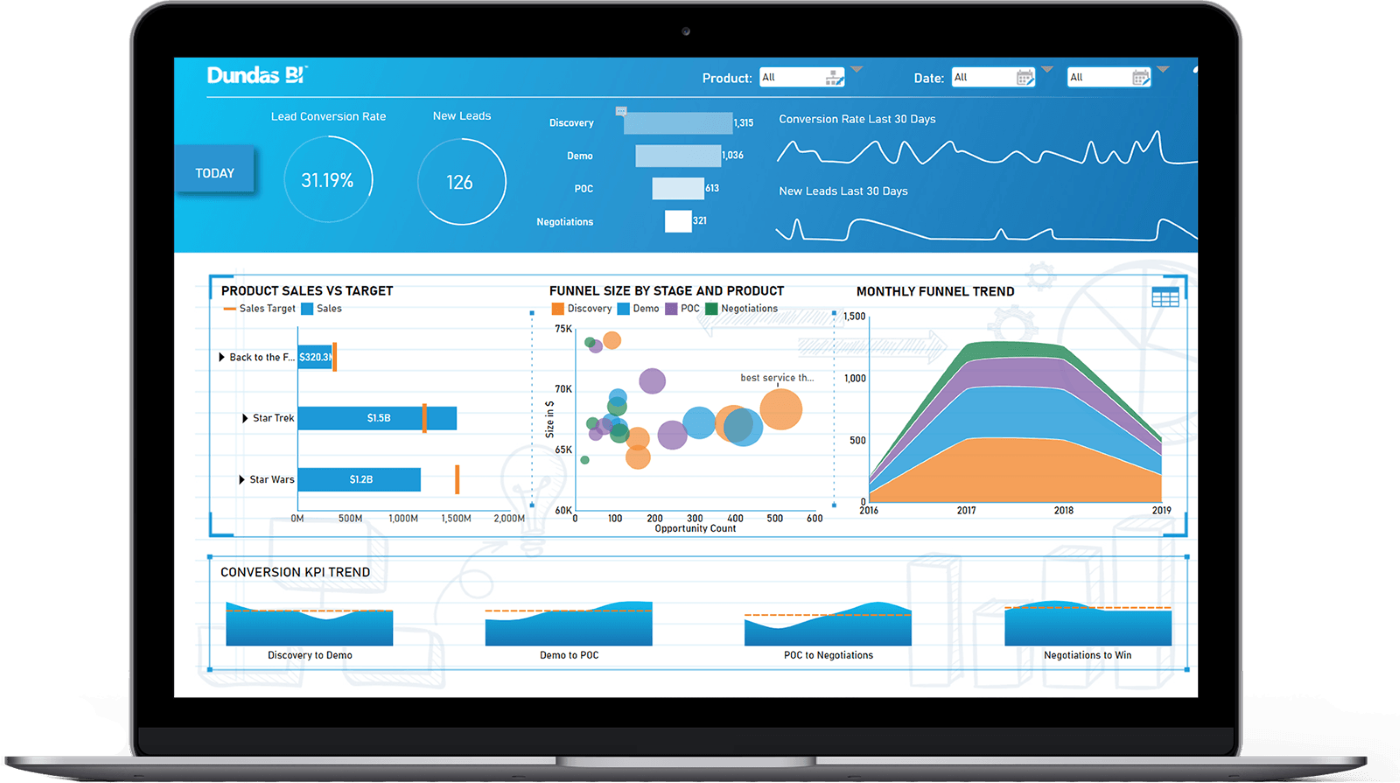
Where the previous BI tools focused on singular deployments (to an internal organization or into a host app that faces external users), Dundas BI is aimed at “multi-tenant” use cases. Whether the host needs it housed on-premises or is deploying to the cloud, Dundas BI offers an analytics engine for those who need to power a variety of apps, platforms, and websites.
The multi-tenant architecture makes it easy for instances and deployments to be isolated via a virtual private cloud. The separation improves security, restricts access, and provides improved control to the team managing the host environment.
Unified Business Intelligence Platform: Dundas BI provides a comprehensive platform for data visualization, reporting, and analytics, consolidating these functions into a single solution.
Drag-and-Drop Interface: The platform features a user-friendly drag-and-drop interface, allowing users to design dashboards, reports, and scorecards without extensive technical expertise.
Customizable Visualizations: Dundas BI offers a wide range of customizable data visualizations, enabling users to tailor their analytics to specific needs and preferences.
Data Integration: The platform supports integration with various data sources, including databases, web services, and Excel, facilitating comprehensive data analysis.
Self-Service Analytics: Dundas BI empowers users to explore and analyze data independently, reducing reliance on IT departments and promoting a data-driven culture.
Starting from $2,500.
Contact Dundas BI for a customized quote.
Embedding BI analytics tools
We actually benefit from embedded analytics tools all the time — whenever we see the engagement metrics of a social post or use a finance app to see where all of our hard-earned cash is going.
The issue with these examples is that the analytics are all native to the app you’re using, meaning the data and the insights are trapped therein.
Standard BI tools suffer from similar drawbacks. Sure, you can dump massive data piles into the hopper, and some fun graphs will come out the other end. But, it can make it difficult to provide access or disseminate the important information at scale, without everyone getting a license to the expensive BI app, that is.
It’s quite the bottleneck for organizations internally. It becomes even more of an obstacle when you want to offer those data insights to external users, though.
Wise BI brands have realized this and have taken steps to enable users to integrate the analytics into other platforms, apps, and dashboards.
Turning analytics inside-out
Whatever the industry, intended use, or other circumstance, embedded business intelligence has two primary uses: internal and external. Using embedded analytics internally provides internal staff with access to the data and related insights. External implementation offers BI functionality to customers, clients, and others using your software.
The advantage in both cases is providing a “native” analytics tool to users, without having to cook one up yourself.
The internal use case, often referred to as “user owns data,” allows teams to integrate the analytics into the software they are already using.
External use cases, known as “app owns data,” are primarily a “white label” situation, where brands embed the analytics in their applications or platforms. This allows outside users and clientele to leverage data insights while using the product by placing the burden for building, maintaining, and powering those automations on the BI vendor.
We mention this because, for one, it helps to illustrate who can benefit from embedded analytics. It also helps us break up the available options into those best for internal or external use.
Methodology
At TechnologyAdvice, we assess a wide range of factors before selecting our top choices for a given category. To make our selections, we rely on our extensive research, product information, vendor websites, competitor research and first-hand experience. We then consider what makes a solution best for customer-specific needs.
For our best embedded analytics tools list, we looked at 25 options before whittling them down to the six that cover all the bases for a quality embedded analytics solutions. We looked at features including security, compliance, ease of use, reporting capabilities, integrations, pricing, ease of setup, and more.
Choosing the right embedded analytics tools
Large ticket software solutions like this can be difficult to shop for due to technical knowledge gaps. The ones who can evaluate the viability of a vendor aren’t usually the ones who sign the contract, and vice versa. Ensure you have every team represented in any software purchase to help minimize surprises.
Like any online shopping experience, don’t be afraid to compare different options, ask questions, and dig deep into the research. Most importantly, be sure to question any claim of “one size fits all,” as no tool can cover every use case.
Hopefully, the above picks give you a starting point for your selection process. If you’re still in need of guidance and insight, check out our Business Intelligence Software Buyer’s Guide.
Frequently Asked Questions (FAQ)
What is embedded analytics?
Embedded analytics allow businesses to create custom analytical profiles of any aspect of their business. That data can then be used internally or externally to aid in a myriad of opportunities.
What are the benefits of embedded analytics?
Embedded analytics tools can help a company gain a competitive advantage, enable data-driven decision-making, identify upsell opportunities, and create a pleasing analytical experience for its clients.