Key takeaways
Featured partners
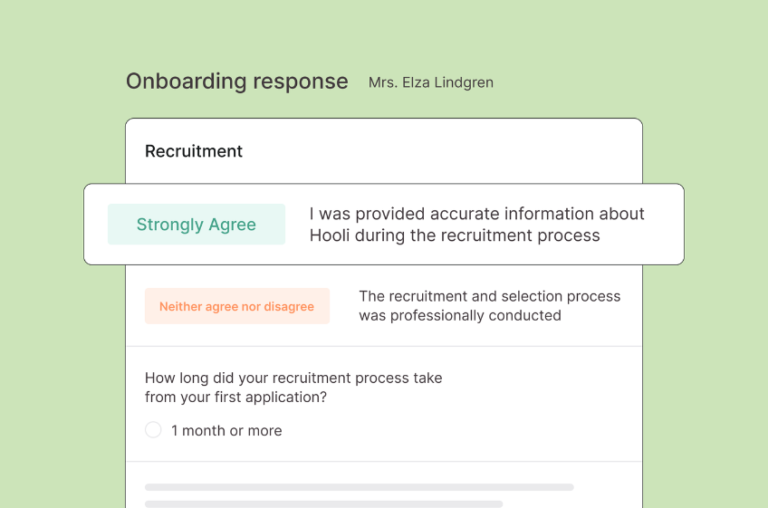
What are employee surveys?
Employee surveys are structured questionnaires that gather input from employees on various aspects of their work lives. Managers and company leaders might use paper-based or digital surveys to dig deep into topics like job satisfaction, engagement, culture, and leadership effectiveness. These are merely examples; there are no limits to what employee surveys can focus on.
Distributing surveys and collecting data is just part one of the process. Analyzing the results, spotting trends, and committing to an action plan are the crucial next steps. It’s how you transform insights into action that will greatly enhance your employees’ experience and your organization’s overall health.
Employee surveys in action:
Internal survey data reveals your employees are unhappy with their lack of access to mental health benefits. You design a strategy to introduce better support within the next three months and communicate your new offering to all staff members. The response is positive; employee productivity rises, and turnover decreases.
What to do with employee survey results
Manual analysis can be time-consuming and tedious, especially if your employee survey receives many responses. An alternative is to use digital survey tools with built-in reporting capabilities that do the legwork for you. These will help you:
- Visualize data.
- Filter based on demographics or other variables.
- Extract relevant comments.
- Suggest focus areas and next steps.
11 steps for analyzing and implementing employee survey results
Your survey deadline has passed, the responses are in, and it’s time to comb through the data. Follow these next steps to turn employee feedback into strategic initiatives.
Step 1: Thank your employees for their participation
Before diving into the data, acknowledge your employees for their time and effort in responding to your survey. When employees feel their voices are heard and appreciated, they’ll likely engage in future surveys and other feedback initiatives.
A simple thank you paired with a reminder of the importance of these surveys can go a long way in reinforcing that you value their insights and intend to act on them. You might customize a variation of the below template to set a positive tone for the entire process.
“Dear [Employee],
Thank you for taking time out of your day to complete our recent employee survey. Your feedback plays a crucial role in shaping our company’s future and is incredibly valuable to us.
Your voice matters and we’re grateful for your contribution.
Best,
[Manager]”
Step 2. Review quantitative data first
Quantitative survey data comes from closed-ended questions in which respondents rate or rank specific aspects of their work experience, such as leadership ratings and overall satisfaction.
These types of questions lack nuance or context, so it’s reasonably quick and straightforward to crunch the numbers and understand how your measurable data compares across different groups or over time.
Example: You ask 50 employees a closed-ended question, such as: “On a scale of 1 to 10, how satisfied are you with your current job (1 is the least satisfied and 10 is the most satisfied)?”
Your response distribution is:
| Score of 1 | 1 employee |
| Score of 2 | 0 employees |
| Score of 3 | 0 employees |
| Score of 4 | 0 employees |
| Score of 5 | 6 employees |
| Score of 6 | 12 employees |
| Score of 7 | 14 employees |
| Score of 8 | 10 employees |
| Score of 9 | 7 employees |
| Score of 10 | 0 employees |
To calculate the average employee satisfaction score, add all the scores together, then divide by 50, to produce an average satisfaction score of 6.88 out of 10.
Total = (1×1) + (5×6) + (6×12) + (7×14) + (8×10) + (9×7) = 344, divided by 50 = 6.88
If this is the first time you’ve collected this information, you’ll use this score as your satisfaction benchmark. Otherwise, you can compare it to previous results; for example, those taken last quarter or year, to understand how your strategy impacts survey responses.
Step 3. Segment the data for detailed insights
It’s worth splitting large datasets into smaller chunks that reveal even more of the story. You might segment your data into groups based on:
- Departments.
- Roles.
- Tenure.
- Age.
- Gender.
- Ethnicity.
This granularity reveals deeper insights, such as your new hires’ opinions compared to those of longer-term employees or whether female workers experience work differently than their male colleagues.
Step 4. Analyze qualitative data
Qualitative data provides the “why” behind the numbers. These answers come from open-ended questions where employees have shared their thoughts and ideas in their own words. You’ll normally capture some incredibly passionate responses in these open text fields as employees feel empowered to speak up and deliver their opinions.
Although it undoubtedly takes longer to read and understand this data, you’ll benefit from deeper responses and context to explain your quantitative findings in more detail.
Example: You ask, “In your own words, how could our company improve your work experience?”
Answers could include insights like:
- “I want better opportunities for professional development and training.”
- “Better communication from upper management would help me feel more aligned with company goals.”
- “I struggle to juggle childcare and work. Flexible hours would significantly improve my work-life balance.”
- “It would be great to have more recognition for our hard work and achievements.”
Step 5. Identify key themes
Based on your quantitative and qualitative answers, identify the most important topics your employees talk about. These can be a mix of things they love about work and also the stressors they want to highlight for your attention. For example, looking at the qualitative data above, your focus areas would be:
- Learning and development.
- Leadership communication.
- Work-life balance.
- Employee recognition.
One way to gain visibility into your employees’ experience of working for you is to use a tool like Culture Amp, which offers 40+ customizable feedback templates on topics as diverse as onboarding, team effectiveness, retention, and performance.
Step 6. Benchmark against past surveys
A one-off employee survey will be useful in some scenarios, such as if you need targeted feedback on a project such as a new office space, or implementing a policy.
However, in most cases, employee surveys are best repeated periodically, allowing you to compare and contrast results over time.
Example: You review employee engagement scores from the year, which are:
- Q1 Engagement Score: 7.2.
- Q2 Engagement Score: 7.5.
- Q3 Engagement Score: 7.4.
- Q4 Engagement Score: 7.8.
The data suggests engagement has fluctuated throughout the year, but is 0.6 higher at the end of the year compared to the start. What does this tell you? If you review data from other years, you might notice that Q1 is always low, perhaps due to post-holiday blues. Or it could coincide with a one-off event or project that impacted engagement.
Dig deep into your data to find patterns. You may also use the Culture Amp Benchmarks feature to compare your figures with other companies in your field, and adjust your action plans as needed.
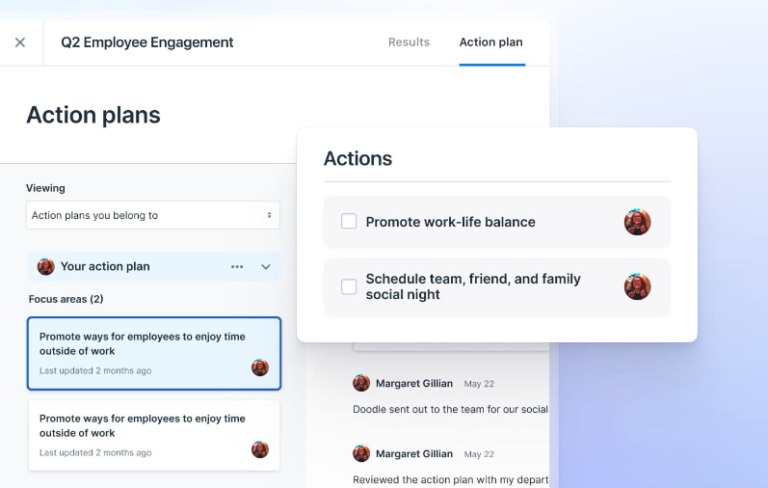
Step 7. Develop a clear action plan
Depending on the volume of data you’ve collected, it might be challenging to know where to start. You can’t tackle everything at once, so start by building a priority list of what you want to work on first.
It makes sense to involve employees, managers, and company leaders in this step to develop clarity on what your workers need and what is possible to deliver. Consider using focus groups, employee resource groups, and 1:1 meetings to extract meaningful insights and form the foundation of your strategy. You might also use a platform like Lattice, which allows you to create survey action plans directly linked to your results.
Step 8: Communicate your results with senior leadership
Present your survey report to members of your senior leadership team, such as your CEO, head of HR, and relevant department heads using visual aids such as graphs and charts to highlight key data points. Employee engagement software with built-in data visualization tools allows you to share these insights to teams in a faster and more efficient way.
Be prepared to discuss potential solutions and action plans for improving lower-score areas. You may also need to research the expenses associated with these solutions to obtain budget approval.
Step 9. Share transparent results with your employees
Looping back to step one, your employees will only feel compelled to complete your surveys if you act on their input. Ensure you communicate what your survey results have revealed and what you plan to do differently.
For example, explain why you cannot act on certain points to ensure employees’ expectations align with reality. Similarly, if your survey results have prompted a new initiative, such as meeting-free days, explain this originated from the employees’ feedback.
Some ways to share these results include:
- Team meetings: Distribute results and next steps to describe how they impact your workers.
- Intranet articles: Publish an article with a summary of your results on your company wiki or knowledge base.
- Communication platform: Leverage communication platforms like Slack or Microsoft Teams to share survey results in real-time with employees and encourage discussion.
- Employee newsletter: Share your survey data and provide updates on progress towards action plans.
Step 10. Monitor progress
Employee survey results are a cycle rather than an event. After acting on your results, measure progress toward your company goals, which might involve tracking one or more of the following metrics:
- Employee retention and turnover rates.
- Employee satisfaction and engagement scores.
- Learning and development participation rates.
- Manager effectiveness scores.
- Employee recognition and reward rates.
You’ll need to repeat your survey periodically and measure any changes to understand how your actions result in impact.
Step 11: Commit to continuous improvement
Regular follow-ups provide a space for managers to check in with their employees and address concerns early rather than letting them fester. Over time, this approach should nudge employee survey results in the right direction. There are various performance management tools that can help streamline this process, depending on your needs and priorities.
Example: An employee has concerns about their mounting workload, causing burnout. They share this during a 1:1 meeting with their manager, and together, they create an action plan to relieve the burden. The employee feels heard and supported. As a result, they receive their next employee engagement survey and select positive answers.
Benefits and challenges of analyzing employee surveys
Employee surveys aren’t a quick project. They require resources, commitment, and analytical skills to source data and channel employee input into strategic workplace improvements. Here’s why they’re worth the effort and how to overcome some common pain points:
Benefits
- Informed decision-making: Data-rich surveys go beyond gut feelings and intangible culture vibes to uncover actionable insights that help leaders, managers, and HR professionals make key decisions.
- Morale boost: Quizzing your workforce on what they want, need, and expect from you makes them feel heard. Don’t expect a significant morale boost after sending out a single survey. But over time, your employees will understand that their opinions hold real value to the company.
- Better organizational performance: Making improvements for employees based on their survey insights can create measurable performance improvements in terms of output, quality, team collaboration, and more.
Challenges
- Data overload: Asking too many questions or providing too many answer choices can result in an overwhelming amount of data to comb through. Overcome this by narrowing your focus to the questions that matter.
- Survey response bias: The way you frame questions can create bias by leading employees to answers they wouldn’t otherwise choose. To avoid this, phrase questions neutrally and offer balanced answer choices.
- Action planning: Prioritizing action steps can be a hard task. Try using a system like the Eisenhower Matrix to evaluate each idea by urgency and importance. For example, you should tackle urgent and important strategies first while placing non-urgent and unimportant plans on the back burner.