


What is org chart software?
Organizational chart software helps companies build a visual representation of dependent groups within a company, software, or organization. The chart can go by several names, including organizational chart, org chart, organogram, or organigram. An org chart shows the working relationships between employees at a company or positions in an organization like a non-profit. The software can also be used to build flow charts that show working and data relationships between systems like databases and computer programs.
Org chart software provides a quick and easy way for companies to build, update, and publish their organizational structure. These tools help employees understand working relationships, find the assigned duties of their peers, or find the manager in charge of a department. The human resources department is often in charge of maintaining and updating the org chart through turnover and new hires.
Find your new organizational chart software
What are the typical uses for org chart software?
These tools are used primarily for showing the reporting structure of a business or organization. Companies use these charts as reference tools that aid in communication. To that end, some of the tools connect to collaboration software to ease inter-departmental or cross-location communication.
Also read: Best Team Collaboration Software
Organizational chart software can also show the organizational structure of databases, software, and data transfer systems, however these functions are more clearly defined by other types of software including diagramming tools and workflow software.
Also read: Building a Strong Executive Team: What Executive to Company Communication Looks Like
What are the types of org charts?
There are several different types of organizational charts you may choose from depending on the type of business you have.
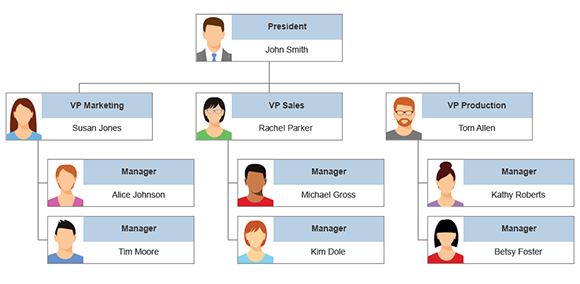
Functional top-down hierarchy chart
If you have a single location or multiple locations that are not autonomous, a functional top-down hierarchy chart might be the right call. These put the C-level executives across the top and then break manager and individual contributor roles into different departments and levels to show the chain of command.
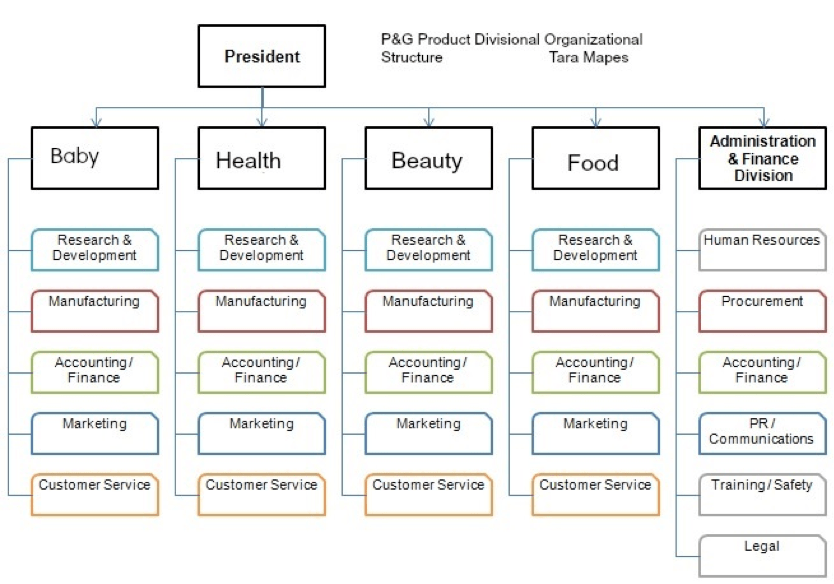
Divisional organizational chart
If you have independent departments or multiple locations that work separately from each other, you should consider a divisional organizational chart. These look similar to the top-down hierarchy charts, but they break hierarchies into lines of business, rather than company departments. For example, HR, accounting, and sales might each have their own charts to show the structure of their department, with those being broken down further to account for different teams within those departments.
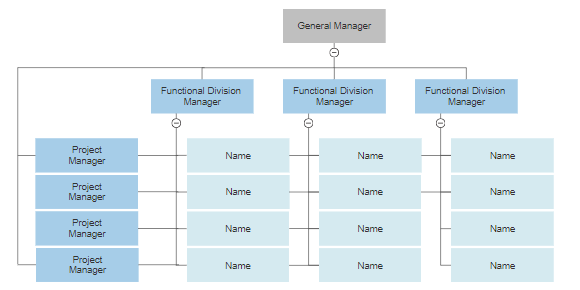
Matrix organizational chart
A matrix organizational chart works well if you have multiple employees that work with more than one department or have more than one supervisor. These charts show connections between the different employees and managers in an attempt to keep from overloading individual employees and helping individual contributors determine which managers they should go to for help with their varying tasks.
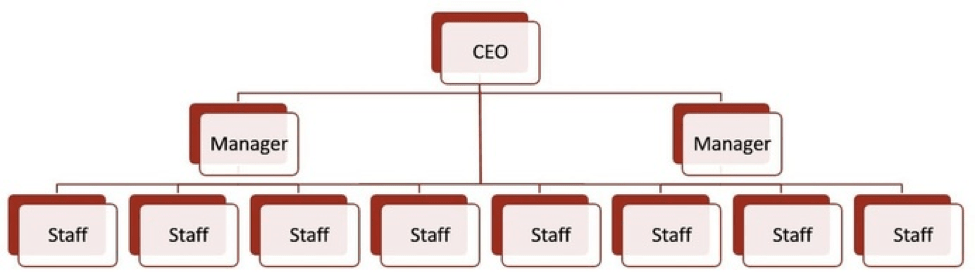
Flat organizational chart
Small businesses with few employees are most often going to use a flat organization chart. Because they don’t usually have a C-suite of executives, flat charts tend to have only two levels: one for managers and one for individual contributors. However, they can have a third level with the CEO at the top. In these charts, businesses use solid lines to identify the primary chain of command and dotted lines to signify secondary hierarchies.
What are the major features of organizational chart software?
While org chart tools come in many varieties, organizational chart software may include these features to extend its function and make it easy for companies to build their own charts.
Templates
To get companies started in building their first organizational chart, org chart software often includes templates. These tools come in a variety of formats that companies can fill in directly or use for idea generation.
An org chart template provides the basic outline of an organizational chart structure that companies can use to build their own chart. These tools come in a range of capabilities from highly advanced software that uses a visual editor to fill in and expand upon the template to PDF documents that your team can print out and fill.
CSV import
Many organizational chart software tools can translate spreadsheets and .CSV documents into org charts or flowcharts. These tools will let you upload or connect a spreadsheet that you build or download from another program, map the data, and build the org chart. These tools are also available via API connections with human resources software.
More advanced tools or those that come as an integrated part of a data visualization or HRIS software will pull org chart information from databases rather than require a separate upload.
A data import feature is especially helpful for large companies with many departments, locations, or subsidiaries. These companies have to continuously update org charts to streamline communications across the company, and spreadsheet uploads or API connections make thes updates quick and easy.
Visual editor
Many data visualization tools like org chart software now include drag-and-drop capabilities in a visual editor. These tools make it easy for anyone on the team to quickly build, edit, and adapt org charts from scratch or from a template. They require very limited technical knowledge because the users click and drag components across the screen rather than use code to place elements.
Flowchart extensibility
Organizational charting software that can expand its functions to build flowcharts, workflows, and software diagrams can be useful for many teams across the company. While org chart software is mostly used by human resources teams or organizational communication departments, flowcharts can be used by many other teams
- Sales teams can track their buyer journey and lead funnels
- Marketing teams can diagram their funnels, email drip campaigns, and personalized marketing tactics
- Software teams can build database infrastructure diagrams and user behavior models
- Manufacturing departments can map assembly to delivery systems
- Logistics teams can build supply chain models
What are the benefits of org chart tools?
Organizational charts help companies plan for their future and provide a host of benefits to help them achieve their goals.
Visible reporting hierarchy
Org charts provide a visible reporting hierarchy, so employees know exactly who they need to go to for help. Employees, especially those who serve multiple departments or have more than one supervisor, may struggle with determining which manager will be best equipped to answer their questions. The organizational chart should list departments and duties to make this clearer.
Easier to identify hiring needs
When the org chart is complete, HR should have a better idea of which departments are understaffed. Listing skills and titles on the organizational chart allows executives to determine where there are gaps and start the recruiting process before the gap causes issues.
More efficient onboarding
Organizational charts also make onboarding more efficient because it’s easier for new employees to see exactly who they should report to and who they’re going to be working with. The names and faces of other members of their department are normally listed on the chart, helping them get familiar with their team before they ever set foot in the office. Additionally, it shows them who they need to go to when they have questions about other departments.
Promotes collaboration
If employees have questions pertaining to other departments, the org chart can show them exactly who to go to in order to get those answered. Often, large projects can’t be completed with interdepartmental knowledge alone, and the organizational chart allows project teams to quickly find the information they need.
How to make an organizational chart
To make a successful organizational chart for your business, you’ll need to follow these steps.
1. Choose the right format for your chart
The type of org chart you build will depend on your audience and the information you want to convey. Choosing the wrong type of chart will add confusion and complexity, when an org chart should remove those from your company. Think critically about the way your business runs before starting to build your organizational chart. You may even want to bring your executives together to discuss the best way to build it.
2. Make your chart the right size for your business
If you’re a huge enterprise with more than 1,000 employees, a single org chart is going to be overwhelming and might cause more confusion than it alleviates. In these situations, it’s better to create smaller organizational charts that break down the different departments or lines of business, so employees get a better idea of exactly who they should be working with.
On the other hand, there’s no reason for a small business with ten employees to break down their organizational chart into more than one. Those ten people will easily fit on a single page, and it should be pretty obvious who each one reports to. If it isn’t clear, that’s more of a reporting structure problem than a charting problem.
3. Add all pertinent information
Your organizational chart should include at the very least an employee’s name and title, but pictures, locations, specialties, and contact information can also be helpful. These details will allow other employees to quickly identify who they should be communicating with based on where they operate from and their area of expertise, and it keeps them from having to search high and low for contact information.
4. Be consistent about shapes, colors, and spacing
If you’re going to shape and color-code your org chart, be consistent about it. Don’t use different shades of the same color if you can help it, and make sure your shapes can be clearly differentiated. You should also include a key that’s clearly labeled, so viewers can quickly identify what they’re looking for.
You should also keep the spacing consistent. This will make it easier to read and look more professional than if you have lots of space at the top while boxes are more crammed together at the bottom.