Key takeaways
When comparing Looker vs. Tableau, two of the most popular business intelligence (BI) software tools on the market today, it’s crucial to have the facts laid out as clearly as possible before making a decision.
Business intelligence software executes data preparation and management, data querying, predictive analytics, and many other analytical tools that help managers make better decisions based on BI outputs. We will look at the features of each BI software tool to give readers more insight into which product will best fit their companies.
Featured partners

Looker
Overall Score
4.16/5
Pricing
3.13/5
General Features & Interface
3.75/5
Core Features
5/5
Advanced Features
4/5
Integration & Compatibility
5/5
UX
3.75/5
Pros
- Powerful data modeling
- Scalable to handle large datasets
- Highly customizable
- Free tier
Cons
- Cost
- Mixes reviews on customer supper
- Limited data security due to cloud hosting
Looker is a cloud-based Business Intelligence (BI) platform purchased by Google in 2019. Designed to offer insights and analytics, its strength lies in the powerful data modeling layer. This layer emphasizes a “single source of truth” model, ensuring accurate metric readings by consolidating information from various sources onto one dashboard.
Looker’s data modeling allows users to define intricate information and create reusable models. These can be used throughout the platform, ensuring data consistency and accuracy. This approach streamlines data exploration, giving users confidence in the displayed data.
The 23.4 release introduced the Looker Studio Connector and Connected Sheets for all Looker-hosted instances. This enhancement allows users to access and analyze Looker-modeled data, expanding the platform’s capabilities. Another feature, the Performant Field Picker Labs, offers refined search options for large Explore field pickers.
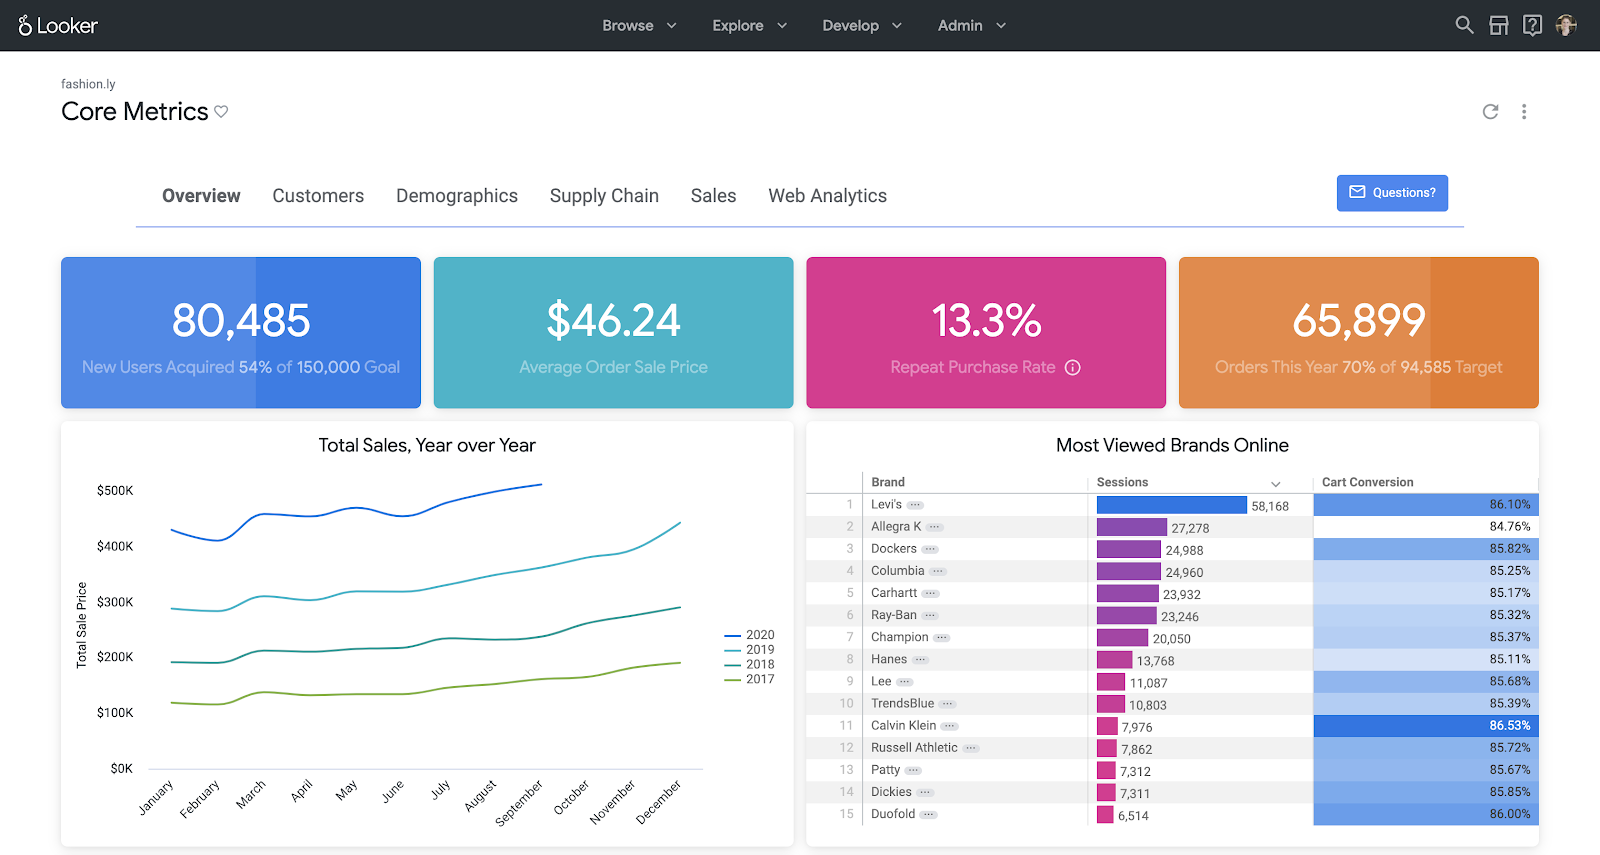
• Data Exploration and Discovery: Looker allows users to explore and discover data in real-time using an intuitive interface that requires no SQL knowledge.
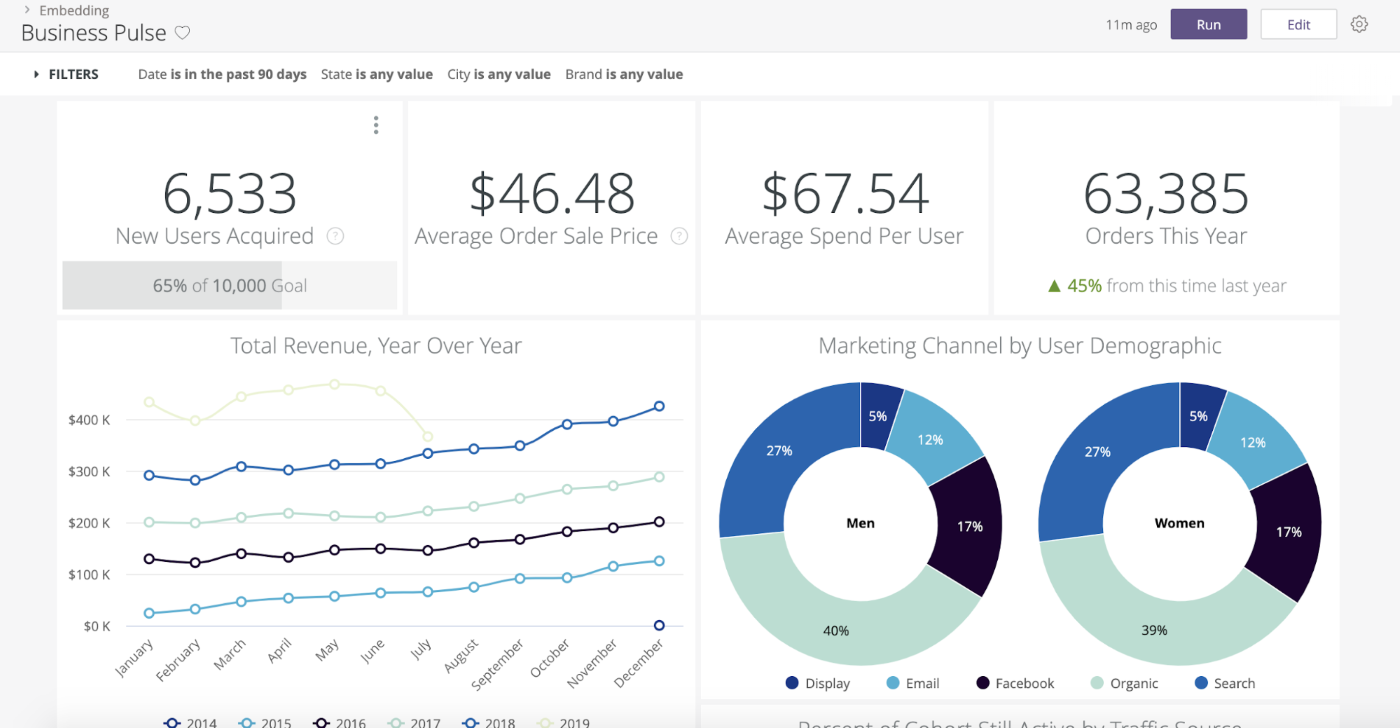
• Customizable Dashboards: Users can create and share interactive, customizable dashboards that offer a comprehensive view of business metrics.
• Integrated Workflow: Looker integrates seamlessly with other tools, enabling users to embed insights directly into business workflows and applications.
• Data Modeling Layer: The LookML modeling layer enables users to define business logic centrally, ensuring consistency across all analytics.
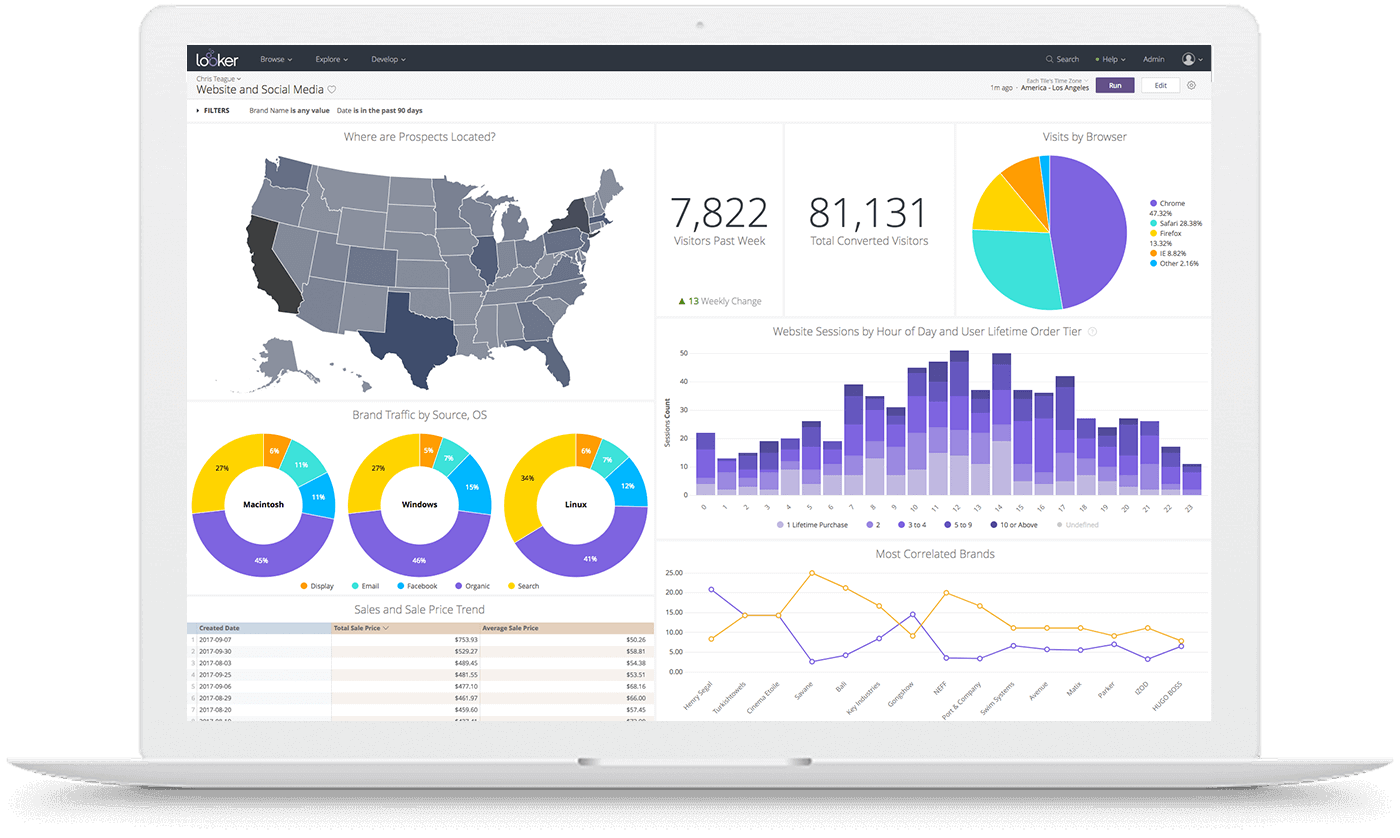
• Collaborative Data Analytics: Looker supports collaboration by allowing users to share data insights with team members through links, dashboards, or scheduled reports.
• Real-Time Data Insights: Looker provides real-time insights, enabling businesses to act on the most current data available.
• Embedded Analytics: Organizations can embed Looker’s analytics capabilities into their own applications to offer data-driven experiences.
• Robust Security and Compliance: Looker offers enterprise-grade security features and compliance certifications, ensuring that data remains safe and secure.

Tableau
Overall Score
4.34/5
Pricing
3.13/5
General Features & Interface
3.75/5
Core Features
5/5
Advanced Features
4/5
Integration & Compatibility
5/5
UX
3.75/5
Pros
- User-friendly interface
- Excellent data visualization capabilities
- Ability to blend data from multiple sources
Cons
- Slow performance when working with large datasets
- Additional software required for advanced data cleaning
Tableau is a data visualization and business intelligence (BI) tool designed to help users interpret and understand their data.
Through its interface, users can create visual representations like dashboards, reports, and charts from raw data. The software allows for data integration from various sources, from databases to cloud services. Over time, Tableau has been adopted by many due to its straightforward features and ability to handle complex data sets. With each release, including the 2023.1 update, Tableau introduces modifications and improvements, reflecting feedback and the changing landscape of data analysis.
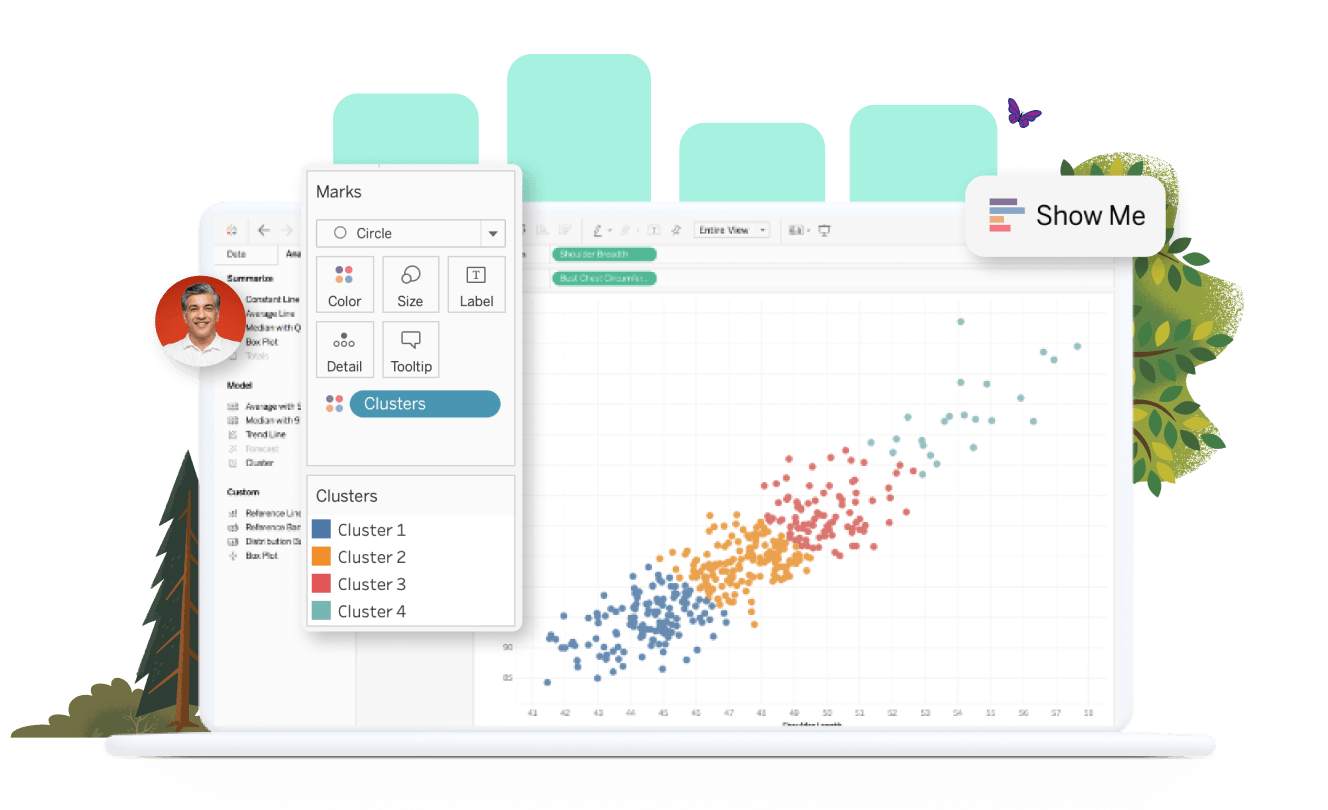
- Data Visualization: Tableau excels in creating powerful, interactive visualizations that help users understand complex data intuitively.
- Drag-and-Drop Interface: The drag-and-drop interface allows users to easily create visualizations and dashboards without the need for advanced technical skills.
- Data Blending: Tableau enables users to combine data from multiple sources into a single view, providing a holistic perspective.
- Real-Time Data Analysis: Users can connect to live data sources and perform real-time analysis to make timely decisions.
- Dashboard Sharing and Collaboration: Tableau allows users to share dashboards and collaborate with others, enhancing teamwork and decision-making.
- Mobile-Friendly Dashboards: Dashboards in Tableau are optimized for mobile devices, ensuring accessibility and usability on the go.
- Advanced Analytics and Calculations: Tableau offers built-in tools for performing advanced analytics, such as trend analysis, forecasting, and statistical modeling.
- Integration with Other Tools: Tableau integrates with a wide range of data sources and tools, including cloud services, databases, and spreadsheets, making it versatile and adaptable.

Looker vs. Tableau: A detailed comparison
Business intelligence software has many tools to provide insightful details managers can use. However, to get the most out of one of these tools, managers need to know the company size, the types of charts and graphs needed, and the business analytical requirements.
With that data in hand, one can use this comparison as a tool to help make your final decision the right decision.
Looker vs. Tableau: Commonalities
Looker and Tableau are both comprehensive, flexible, and scalable solutions that prioritize user accessibility and collaboration. While they each have their unique strengths and weaknesses, these core commonalities make them leading choices in the realm of business intelligence software:
Looker and Tableau both offer an array of BI tools to help businesses make informed decisions using advanced Machine Learning (ML) concepts.
Both platforms are incredibly user-friendly
You don’t need to be a data scientist to navigate through them; they’re built for everyone from the intern in the marketing department to the CFO. This universal appeal is what makes them so indispensable.
It’s like having a universal remote for all your data sources
Integration is another area where both stand out. Whether your data lives in the cloud, in SQL databases, or even in good old Excel sheets, Looker and Tableau make it a easy to pull that data in.
Let’s talk about scalability
Looker and Tableau have engineered their platforms to be highly scalable so they grow alongside your business.
Tableau offers a distributed server architecture that allows you to add more server nodes as your data and user base expand. This means you can handle larger data sets and more concurrent users without sacrificing performance.
Looker leverages an in-database architecture, allowing it to push queries to the database itself. This ensures that as your data grows, you can scale your database resources to maintain high-speed analytics. Both platforms also offer cloud-based solutions, providing the elasticity to quickly scale up or down based on your needs.
Both tools are big on teamwork
They offer nifty collaboration features that make it easy to share insights, annotate findings, and even distribute reports. It’s like a virtual huddle for your team, where everyone gets to contribute to the game plan.
Also read: Tableau Alternatives
Looker vs. Tableau: Key differences
Looker is fully deployed as a browser-based intelligence software with no desktop installation requirement. In addition, Looker offers a mobile app solution. Tableau is a desktop-based platform with a Tableau license for cloud access but with limited cloud capabilities. Looker uses its version of structured query language called LookML with pre-built Looker Blocks. Tableau uses a spatial file connector to create maps.
While those are substantial differences, when it comes to team-facing features, the two titles serve the same overall purpose.
What are the key features of Looker?
Looker offers several key features that will enhance the ability to view data in real-time, build applications with embedded analytics, and provide proactive insights with instant alerting for quicker decision-making. Here are some of the key features of Looker:
What are the key features of Tableau?

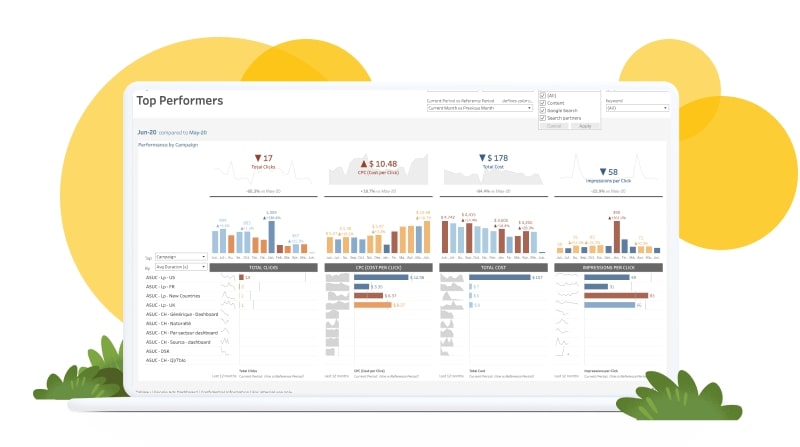
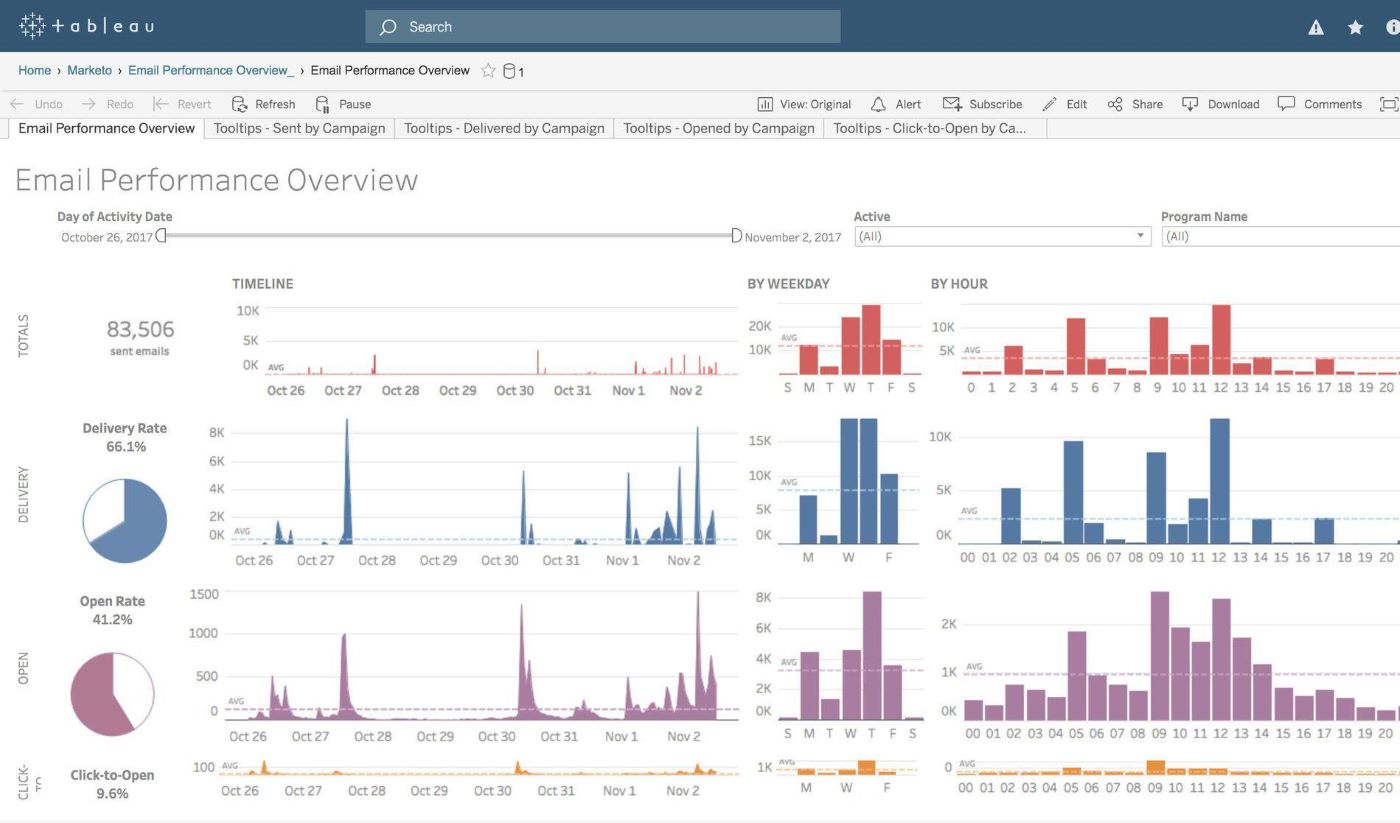
Tableau’s focus is on creating sophisticated visual representations of data. As a result, Tableau allows users to quickly analyze large amounts of data that can be converted into reports. Tableau has a heavy focus on dashboards, but here are some other key features of this BI solution:
Looker vs. Tableau: Pricing
Looker pricing:
- Platform pricing: Looker offers three editions—Standard, Enterprise, and Embed. The Standard edition costs $5,000 per month with a pay-as-you-go model. Enterprise and Embed editions require you to call sales for an annual commitment.
- User licensing: Looker offers three types of user licenses—Viewer ($30/user/month), Standard ($60/user/month), and Developer ($125/user/month). These fees are consistent across all editions.
Tableau pricing:
- License tiers: Tableau offers three tiers—Creator, Explorer, and Viewer. The Creator license is $70/user/month for the cloud version and $35/user/month for on-premise. The Explorer license is $42/user/month for cloud and $20/user/month for on-premise. The Viewer license is $15/user/month for cloud and $10/user/month for on-premise.
- Enterprise package: Tableau also offers an enterprise package with custom pricing.
- Additional Costs: Some users have noted that Tableau may require additional tools for data extraction, adding to the total cost.
Key takeaways
- Looker offers a more customized pricing model, allowing for tailored solutions. Tableau offers fixed pricing tiers, which may or may not suit all organizational needs.
- Both platforms offer tiered user licensing but differ in costs and capabilities.
- Tableau provides upfront pricing, whereas Looker requires you to engage with their sales team for most of their offerings.
Looker vs. Tableau: Feature comparison overview
As you can see, Looker and Tableau have different key features available to users. This section will look at some of the expected features of a business intelligence and data analytics software solution.
| Feature | Looker | Tableau | Advantage |
|---|---|---|---|
| Data Visualization | Looker provides a dynamic dashboard filter feature that can filter for data visualization types and specific users or groups. Looker also has a mapping feature to aid in chart creation. | Tableau specializes in visualization dashboards and infographics. Tableau provides pre-made templates and has a wizard feature that helps non-technical users. |  |
| Integration | Looker integrates with big data platforms and databases and can execute queries without extracting data | Tableau has over 200 connectors that can connect to multiple sources such as RDBMS, spreadsheets, Presto, SQL Server, Cloudera, Hadoop, Amazon Athena, and Salesforce | |
| Data Modeling | LookML is a data modeling tool that is reusable and flexible. LookML has pre-built modeling called Looker Blocks used to build sophisticated query analytics | Tableau uses snowflakes and dimensional data models that help improve the performance of queries | |
| Reporting | Provides basic reporting templates | Users can build customized reports with extensive connectors to create dashboards and reports | |
| Speed | Looker is slower, and users may need several hours to share a report | Allows a user to create visualization reports in short periods | |
| Advanced Analytics | Looker pre-built code blocks are configurable, and LookLM allows for a deeper analytical review of data | Tableau does not have pre-built code blocks, but it is more configurable than Looker | |
| Security | Looker provides an admin panel to change security settings and 2-factor authentication | Tableau allows a user to protect reports and dashboards, but not with the detail of Looker | |
| Mobile Support | Looker’s mobile app allows you to view data using any browser with an Internet connection. Emails and chat sessions are available too. Users can log in using a QR code or biometrics | Android and iOS devices can use Tableau’s mobile web application | |
| Pricing | For a company, $5,000/per month, but Looker offers a variety of business plans depending on size | Tableau’s creator license cost per user is $70/per month, and for a viewer, it’s $15/per month | |
Looker vs. Tableau: Which BI software is right for your business
The best BI solution is subjective since every company’s situation differs slightly. For example, a company that uses Salesforce may lean towards Tableau since Salesforce purchased Tableau four years ago. Any company heavily invested in using Google products may lean towards Looker. Just because a company uses Google or Salesforce products should not be the basis for a decision.
Other factors to consider are the existing infrastructure, analytical data needs, and storage preferences, whether cloud or local, are only a subset of reasons why a company may choose one BI product over the other.
How to choose between Tableau vs Looker
A business need for a BI software solution was identified as a requirement. Next, the company generates a list of requirements on why BI software is needed. These requirements vary from company to company, but they are the driving force behind choosing a BI solution. Finally, decision-makers are on track to make the right decision using the key features and the comparison overview along with additional research.
Looking for the latest in Business Intelligence solutions? Check out our Business Intelligence Software Buyer’s Guide.