Key takeaways
- Project management dashboards help teams move from reactive tracking to real-time, data-driven decision-making by surfacing the most critical project insights in one place.
- Dashboards become a shared source of truth, aligning teams, stakeholders, and even clients around the same data and progress.
- The most valuable dashboards aren’t the most complex—they’re the ones tailored to the right metrics, roles, and decisions your team needs to make.
Project management systems offer dashboards as part of their core feature set to give project managers and team members instant access to critical insights and metrics. These dashboards come with a variety of tools and customization options that vary across providers. If you’re looking to make the most of project management dashboards, this article explores how they support better decision-making, improve visibility, and strengthen execution across the project lifecycle.
What is a project management dashboard?
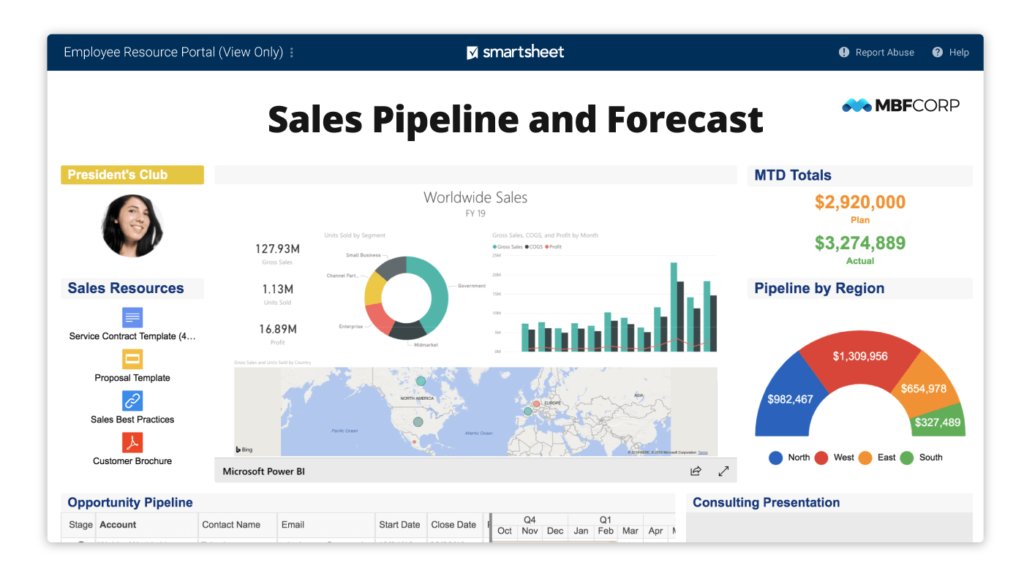
Project management dashboards are typically accessed through project management software and help teams organize, track, and execute their work more effectively. A dashboard’s main purpose is to provide a consolidated, visual view of project data within a single interface.
In my experience, the real value of dashboards is clarity. They give project managers, team members, and stakeholders an at-a-glance understanding of project status without needing to dig through multiple tools or reports. This information is typically presented through charts, graphs, tables, and other visual indicators of performance.
Most dashboards surface key project data such as:
- Budget and financial tracking
- Resource allocation and utilization
- Milestone progress
- Task completion and status
By bringing this information together, dashboards make it easier to identify what’s on track, spot issues early, and take action before problems escalate. Instead of reacting late, teams can recognize patterns and respond proactively.
Beyond tracking, dashboards also improve how teams work together. With a shared, real-time view of project data, teams can make more informed decisions, reduce miscommunication, and stay aligned on priorities and outcomes.
What are the benefits of project management dashboards?
There are a wide variety of benefits that dashboards can deliver. Personally, I’ve noticed their real value shows up in how teams make decisions, prioritize work, and stay aligned in fast-moving environments. Not every benefit will apply equally to every team, but the patterns below highlight where dashboards tend to have the biggest impact.
1. Enhanced visibility and transparency
Team members and stakeholders can gain a real-time, centralized view of project data and metrics using project management dashboards.
Dashboards solve one of the most common project challenges: fragmented visibility. Instead of pulling updates from multiple tools or stakeholders, teams get a real-time, centralized view of project data and performance. This makes it easier for stakeholders to quickly assess project health without relying on status meetings or manual reports.
For example, a project manager can instantly see if a milestone is delayed due to resource constraints, while an executive can check overall progress without needing a separate briefing.
2. Improved data-driven decision-making
Dashboards make it significantly easier to move from intuition-based decisions to data-driven ones. I’ve seen teams shift from reacting to issues after the fact to proactively identifying risks by monitoring trends in real time.
By reviewing performance metrics, data trends, and patterns, teams can identify areas for improvement and manage task statuses. In addition, project teams can take actionable steps to continuously refine their processes, leading to successful project outcomes.
For example, if task completion rates start to drop or resource utilization spikes, teams can quickly investigate and adjust before deadlines are impacted. Instead of waiting for end-of-week reports, decisions can happen in the moment.
Additionally, project management dashboards can visually represent resources allocated to projects, tasks, and team members. This enables project managers to easily understand the resources used for specific activities and make informed estimates of which resources are necessary for future projects.
3. Efficiency and productivity
One of the most immediate benefits I’ve seen is the reduction in manual reporting. Dashboards consolidate data automatically, eliminating the need to gather updates from multiple sources or build reports from scratch.
Instead of spending hours compiling weekly status updates, teams can pull directly from a live dashboard that’s already up to date. This not only saves time but also reduces the risk of errors or outdated information.
This can save organizations costs for hiring manual labor, save team members time and effort, and allow teams to focus on their core tasks. Altogether, automatically consolidating data within dashboards can increase efficiency and productivity and minimize human error and compliance issues.
4. Better risk management
Risk assessment and tracking features make it easy for project managers to identify and mitigate potential risks proactively.
A dashboard might highlight a dependency that’s blocking multiple tasks or show a budget trending over target. Instead of discovering these issues too late, teams can step in early and adjust course.
When included within project management dashboards, these features offer a clear visual representation of potential risks and issues so project teams can take preventive measures and manage risks before they impact project outcomes. Tracking features can also inform teams of existing problems so they can resolve them.
5. Communication and collaboration support
Project management dashboards can contain features that facilitate communication and collaboration among team members and stakeholders. Features may include status updates, messaging, commenting, change requests, and tools for project data sharing.
By providing a centralized platform for communicating and sharing project data, project dashboards promote effective communication, encourage collaboration, and reduce confusion throughout the project life cycle. They can act as a single source of truth, ensuring all viewers’ understand the project scope.
This reduces confusion in cross-functional teams, especially when multiple stakeholders are involved. For example, a client, project manager, and internal team can all view the same dashboard to understand progress, upcoming milestones, and any blockers.
Team members, clients, and executives can access current, accurate, and centralized data to help them reach decisions together. Team members can also use this data to create reports on current information, forecasts, and historical data for clearly communicating concepts to external individuals.
6. Real-time project monitoring
Real-time visibility changes how teams respond to issues. Instead of waiting for periodic updates, teams can monitor progress continuously and take action as soon as something shifts.
If a critical task falls behind schedule, for example, the team can immediately reassign resources or adjust priorities rather than discovering the delay days later. This ability to act quickly is one of the biggest drivers of improved delivery timelines and reduced project risk.
7. Targeted data views
Not every stakeholder needs the same information and dashboards allow teams to tailor views accordingly. This is especially valuable in larger organizations where different roles focus on different metrics.
An executive might focus on high-level KPIs like budget and timeline, while a project manager needs detailed task-level data. Customizable dashboards ensure each user sees what’s most relevant to them.
Additionally, this flexibility supports scalability for organizations, as users can adjust their dashboards based on the KPIs and other aspects necessary for achieving growth.
8. Optimized scheduling and prioritization
Dashboards make it easier to understand how work is distributed across timelines and resources. I’ve seen teams use this visibility to identify scheduling conflicts, rebalance workloads, and prioritize high-impact tasks.
If multiple deadlines overlap or a key resource is over-allocated, teams can adjust plans before it affects delivery. This results in a more realistic scheduling and better prioritization across projects.
9. Easier time and activity tracking
By viewing the completion status of multiple projects, users can ensure their timely completion and identify which projects require prioritization or extra attention. Milestone tracking through project management dashboards is another way to quickly determine the health of a project based on its progress.
For example, if one project is lagging behind others, teams can quickly investigate whether it’s due to resource constraints, scope creep, or unexpected blockers.
10. Smarter project spending
Financial and budgeting data provided within project management dashboards can tell viewers a lot about the project’s spending activity.
For example, users can track spending to avoid going over budget before the project’s completion and view KPIs to reach valuable insights about the project’s profitability, rate of growth, and sales forecast. In my experience, this kind of visibility leads to more disciplined financial planning and better long-term project outcomes.
What should a project management dashboard contain?
A project management dashboard can contain a wide variety of key data and metrics. But after using so many of them, I’ve learned the most effective dashboards aren’t the ones with the most information. They’re the ones that surface the right information to help teams make decisions quickly and confidently.
Rather than trying to track everything, teams should focus on building dashboards that provide a clear, real-time view of project health, performance, and risk. Below are the core elements that consistently add value.
Descriptions
A strong dashboard starts with context. A brief project description should outline the purpose of the project, its goals, and how success is defined. This is especially useful for new stakeholders or cross-functional teams. For example, an executive reviewing multiple dashboards can quickly understand how each project ties back to broader business objectives.
Project progress status indicators
Dashboards should make it immediately clear whether a project is on track, at risk, or delayed. Visual indicators like progress bars, status labels, or color coding (e.g., green/yellow/red) help teams assess status at a glance.
I’ve seen this be particularly valuable in fast-moving environments where teams don’t have time to read detailed reports. A quick glance at status indicators can surface issues that need immediate attention.
Key performance indicators
KPIs provide a measurable view of project performance and overall health. The most effective dashboards focus on a small set of meaningful metrics rather than overwhelming users with data.
For example, teams often track:
- Resource utilization
- Task completion rates
- Budget vs. actual spend
In my experience, dashboards become far more actionable when KPIs are tied directly to decisions, such as whether to reallocate resources or adjust timelines.
Milestones and timelines
Dashboards should display projects with tasks, sub-tasks, and milestones necessary to help teams understand where they are in the project lifecycle and what’s coming next.
For example, a timeline view can highlight upcoming deadlines or show when multiple milestones overlap, helping teams prepare in advance. This is especially useful for coordinating across teams with shared dependencies.
Dependencies and impacted metrics
Projects, tasks, and sub-tasks should all be displayed in relation to one another and their linked objectives. This can also include information about delayed deliverables due to dependencies.
For instance, if one delayed deliverable is holding up multiple downstream tasks, a dashboard can make that relationship visible, which helps teams to prioritize the right work instead of reacting too late.
Resource allocation and estimates
Dashboards should include a visual representation of the resources allocated to different tasks or team members. This can consist of estimates of those resources and the time necessary for task completion. Information regarding the task’s owner should also be communicated so viewers can see who is in charge of which project.
Teams often use this to quickly spot imbalances. For example, when one team member is over-allocated while others have capacity. This visibility makes it easier to rebalance workloads and prevent burnout or delays..
Budgets and financials
Project management dashboards can also display budget information and real-time data tracking of project spending activity. This information can be shown in various ways to indicate the percent budget spent, percent complete, and the forecasted total project cost.
In addition, some project management dashboards can include tools for tracking financial KPIs, like the Net Present Value, Internal Rate of Return, and sales forecasting.
For example, if a project is trending over budget early on, teams can adjust scope or reallocate resources before costs escalate. Some dashboards also include advanced financial metrics like forecasted ROI or cost variance.
Risk status and issues
Viewers should be able to access information about potential risks and issues identified throughout the project via the project dashboard. This section should indicate the severity and status of these risks and their impact and likelihood of occurring.
Custom views and features
Customizable dashboards enable project team members to customize their dashboard views based on the information that is most relevant to them. Additionally, some software can allow users to create personal to-do lists.
For example:
- Executives may want high-level KPIs and budget summaries
- Project managers may need detailed task and resource views
This flexibility ensures dashboards remain useful without becoming overwhelming.
Collaboration tools
Project management dashboards can include communication and collaboration tools like commenting, messaging, and update-sharing features. For example, Smartsheet allows team members to collaborate on shared sheets. Project dashboards can also store change request information for users to view the transformation of projects as they have been adjusted over time.
This can reduce the need for separate communication channels. For example, instead of discussing a delay in a meeting, team members can comment directly on the affected task within the dashboard and keep context and decisions in one place.
Choosing a project management tool
A project management dashboard should clearly and concisely represent critical project data and metrics that enable effective monitoring, decision-making, and stakeholder communication.
When choosing a project management dashboard software, teams should identify their goals to stay competitive within their business environment. This will help them determine the KPIs and features they should seek in a project management dashboard solution.
From enhanced visibility to optimizing data-driven decision-making, the right project management dashboard can offer many advantages that positively impact project outcomes and overall organizational success.
Many general project management tools include dashboards that can pull information from project boards and individual tasks. If you’re shopping around for project management software, review our list of top project management tools to see which fit your needs.
Featured partnersFeatured project management partners
Key takeaways
- Project management dashboards help teams move from reactive tracking to real-time, data-driven decision-making by surfacing the most critical project insights in one place.
- Dashboards become a shared source of truth, aligning teams, stakeholders, and even clients around the same data and progress.
- The most valuable dashboards aren’t the most complex—they’re the ones tailored to the right metrics, roles, and decisions your team needs to make.
Effective project management is vital for organizations to achieve their objectives, especially as projects involve more moving parts and complexity. In our experience, success depends not just on coordination and collaboration, but on how clearly teams can see what’s happening across a project at any given time.
For this reason, many project management tools now include dashboards to improve visibility for project managers and team members. These dashboards streamline project management by providing real-time views of project data, insights, and key metrics in one place. But how much of a difference do they actually make in practice?
If you’re curious about the benefits that project management dashboards can provide, this article explores how they support better decision-making, improve visibility, and strengthen execution across the project lifecycle.
By using these tools effectively, organizations can help their teams deliver projects more consistently on time and within budget.
What is a project management dashboard?
Project management dashboards are typically accessed through project management software and help teams organize, track, and execute their work more effectively. A dashboard’s main purpose is to provide a consolidated, visual view of project data within a single interface.
In my experience, the real value of dashboards is clarity. They give project managers, team members, and stakeholders an at-a-glance understanding of project status without needing to dig through multiple tools or reports. This information is typically presented through charts, graphs, tables, and other visual indicators of performance.
Most dashboards surface key project data such as:
- Budget and financial tracking
- Resource allocation and utilization
- Milestone progress
- Task completion and status
By bringing this information together, dashboards make it easier to identify what’s on track, spot issues early, and take action before problems escalate. Instead of reacting late, teams can recognize patterns and respond proactively.
Beyond tracking, dashboards also improve how teams work together. With a shared, real-time view of project data, teams can make more informed decisions, reduce miscommunication, and stay aligned on priorities and outcomes.
What are the benefits of project management dashboards?
There are a wide variety of benefits that dashboards can deliver. Personally, I’ve noticed their real value shows up in how teams make decisions, prioritize work, and stay aligned in fast-moving environments. Not every benefit will apply equally to every team, but the patterns below highlight where dashboards tend to have the biggest impact.
1. Enhanced visibility and transparency
Team members and stakeholders can gain a real-time, centralized view of project data and metrics using project management dashboards.
Dashboards solve one of the most common project challenges: fragmented visibility. Instead of pulling updates from multiple tools or stakeholders, teams get a real-time, centralized view of project data and performance. This makes it easier for stakeholders to quickly assess project health without relying on status meetings or manual reports.
For example, a project manager can instantly see if a milestone is delayed due to resource constraints, while an executive can check overall progress without needing a separate briefing.
2. Improved data-driven decision-making
Dashboards make it significantly easier to move from intuition-based decisions to data-driven ones. I’ve seen teams shift from reacting to issues after the fact to proactively identifying risks by monitoring trends in real time.
By reviewing performance metrics, data trends, and patterns, teams can identify areas for improvement and manage task statuses. In addition, project teams can take actionable steps to continuously refine their processes, leading to successful project outcomes.
For example, if task completion rates start to drop or resource utilization spikes, teams can quickly investigate and adjust before deadlines are impacted. Instead of waiting for end-of-week reports, decisions can happen in the moment.
Additionally, project management dashboards can visually represent resources allocated to projects, tasks, and team members. This enables project managers to easily understand the resources used for specific activities and make informed estimates of which resources are necessary for future projects.
3. Efficiency and productivity
One of the most immediate benefits I’ve seen is the reduction in manual reporting. Dashboards consolidate data automatically, eliminating the need to gather updates from multiple sources or build reports from scratch.
Instead of spending hours compiling weekly status updates, teams can pull directly from a live dashboard that’s already up to date. This not only saves time but also reduces the risk of errors or outdated information.
This can save organizations costs for hiring manual labor, save team members time and effort, and allow teams to focus on their core tasks. Altogether, automatically consolidating data within dashboards can increase efficiency and productivity and minimize human error and compliance issues.
4. Better risk management
Risk assessment and tracking features make it easy for project managers to identify and mitigate potential risks proactively.
A dashboard might highlight a dependency that’s blocking multiple tasks or show a budget trending over target. Instead of discovering these issues too late, teams can step in early and adjust course.
When included within project management dashboards, these features offer a clear visual representation of potential risks and issues so project teams can take preventive measures and manage risks before they impact project outcomes. Tracking features can also inform teams of existing problems so they can resolve them.
5. Communication and collaboration support
Project management dashboards can contain features that facilitate communication and collaboration among team members and stakeholders. Features may include status updates, messaging, commenting, change requests, and tools for project data sharing.
By providing a centralized platform for communicating and sharing project data, project dashboards promote effective communication, encourage collaboration, and reduce confusion throughout the project life cycle. They can act as a single source of truth, ensuring all viewers’ understand the project scope.
This reduces confusion in cross-functional teams, especially when multiple stakeholders are involved. For example, a client, project manager, and internal team can all view the same dashboard to understand progress, upcoming milestones, and any blockers.
Team members, clients, and executives can access current, accurate, and centralized data to help them reach decisions together. Team members can also use this data to create reports on current information, forecasts, and historical data for clearly communicating concepts to external individuals.
6. Real-time project monitoring
Real-time visibility changes how teams respond to issues. Instead of waiting for periodic updates, teams can monitor progress continuously and take action as soon as something shifts.
If a critical task falls behind schedule, for example, the team can immediately reassign resources or adjust priorities rather than discovering the delay days later. This ability to act quickly is one of the biggest drivers of improved delivery timelines and reduced project risk.
7. Targeted data views
Not every stakeholder needs the same information and dashboards allow teams to tailor views accordingly. This is especially valuable in larger organizations where different roles focus on different metrics.
An executive might focus on high-level KPIs like budget and timeline, while a project manager needs detailed task-level data. Customizable dashboards ensure each user sees what’s most relevant to them.
Additionally, this flexibility supports scalability for organizations, as users can adjust their dashboards based on the KPIs and other aspects necessary for achieving growth.
8. Optimized scheduling and prioritization
Dashboards make it easier to understand how work is distributed across timelines and resources. I’ve seen teams use this visibility to identify scheduling conflicts, rebalance workloads, and prioritize high-impact tasks.
If multiple deadlines overlap or a key resource is over-allocated, teams can adjust plans before it affects delivery. This results in a more realistic scheduling and better prioritization across projects.
9. Easier time and activity tracking
By viewing the completion status of multiple projects, users can ensure their timely completion and identify which projects require prioritization or extra attention. Milestone tracking through project management dashboards is another way to quickly determine the health of a project based on its progress.
For example, if one project is lagging behind others, teams can quickly investigate whether it’s due to resource constraints, scope creep, or unexpected blockers.
10. Smarter project spending
Financial and budgeting data provided within project management dashboards can tell viewers a lot about the project’s spending activity.
For example, users can track spending to avoid going over budget before the project’s completion and view KPIs to reach valuable insights about the project’s profitability, rate of growth, and sales forecast. In my experience, this kind of visibility leads to more disciplined financial planning and better long-term project outcomes.
What should a project management dashboard contain?
A project management dashboard can contain a wide variety of key data and metrics. But after using so many of them, I’ve learned the most effective dashboards aren’t the ones with the most information. They’re the ones that surface the right information to help teams make decisions quickly and confidently.
Rather than trying to track everything, teams should focus on building dashboards that provide a clear, real-time view of project health, performance, and risk. Below are the core elements that consistently add value.
Descriptions
A strong dashboard starts with context. A brief project description should outline the purpose of the project, its goals, and how success is defined. This is especially useful for new stakeholders or cross-functional teams. For example, an executive reviewing multiple dashboards can quickly understand how each project ties back to broader business objectives.
Project progress status indicators
Dashboards should make it immediately clear whether a project is on track, at risk, or delayed. Visual indicators like progress bars, status labels, or color coding (e.g., green/yellow/red) help teams assess status at a glance.
I’ve seen this be particularly valuable in fast-moving environments where teams don’t have time to read detailed reports. A quick glance at status indicators can surface issues that need immediate attention.
Key performance indicators
KPIs provide a measurable view of project performance and overall health. The most effective dashboards focus on a small set of meaningful metrics rather than overwhelming users with data.
For example, teams often track:
- Resource utilization
- Task completion rates
- Budget vs. actual spend
In my experience, dashboards become far more actionable when KPIs are tied directly to decisions, such as whether to reallocate resources or adjust timelines.
Milestones and timelines
Dashboards should display projects with tasks, sub-tasks, and milestones necessary to help teams understand where they are in the project lifecycle and what’s coming next.
For example, a timeline view can highlight upcoming deadlines or show when multiple milestones overlap, helping teams prepare in advance. This is especially useful for coordinating across teams with shared dependencies.
Dependencies and impacted metrics
Projects, tasks, and sub-tasks should all be displayed in relation to one another and their linked objectives. This can also include information about delayed deliverables due to dependencies.
For instance, if one delayed deliverable is holding up multiple downstream tasks, a dashboard can make that relationship visible, which helps teams to prioritize the right work instead of reacting too late.
Resource allocation and estimates
Dashboards should include a visual representation of the resources allocated to different tasks or team members. This can consist of estimates of those resources and the time necessary for task completion. Information regarding the task’s owner should also be communicated so viewers can see who is in charge of which project.
Teams often use this to quickly spot imbalances. For example, when one team member is over-allocated while others have capacity. This visibility makes it easier to rebalance workloads and prevent burnout or delays..
Budgets and financials
Project management dashboards can also display budget information and real-time data tracking of project spending activity. This information can be shown in various ways to indicate the percent budget spent, percent complete, and the forecasted total project cost.
In addition, some project management dashboards can include tools for tracking financial KPIs, like the Net Present Value, Internal Rate of Return, and sales forecasting.
For example, if a project is trending over budget early on, teams can adjust scope or reallocate resources before costs escalate. Some dashboards also include advanced financial metrics like forecasted ROI or cost variance.
Risk status and issues
Viewers should be able to access information about potential risks and issues identified throughout the project via the project dashboard. This section should indicate the severity and status of these risks and their impact and likelihood of occurring.
Custom views and features
Customizable dashboards enable project team members to customize their dashboard views based on the information that is most relevant to them. Additionally, some software can allow users to create personal to-do lists.
For example:
- Executives may want high-level KPIs and budget summaries
- Project managers may need detailed task and resource views
This flexibility ensures dashboards remain useful without becoming overwhelming.
Collaboration tools
Project management dashboards can include communication and collaboration tools like commenting, messaging, and update-sharing features. For example, Smartsheet allows team members to collaborate on shared sheets. Project dashboards can also store change request information for users to view the transformation of projects as they have been adjusted over time.
This can reduce the need for separate communication channels. For example, instead of discussing a delay in a meeting, team members can comment directly on the affected task within the dashboard and keep context and decisions in one place.
Choosing a project management tool
A project management dashboard should clearly and concisely represent critical project data and metrics that enable effective monitoring, decision-making, and stakeholder communication.
When choosing a project management dashboard software, teams should identify their goals to stay competitive within their business environment. This will help them determine the KPIs and features they should seek in a project management dashboard solution.
From enhanced visibility to optimizing data-driven decision-making, the right project management dashboard can offer many advantages that positively impact project outcomes and overall organizational success.
Many general project management tools include dashboards that can pull information from project boards and individual tasks. If you’re shopping around for project management software, review our list of top project management tools to see which fit your needs.