What is Gantt chart software?
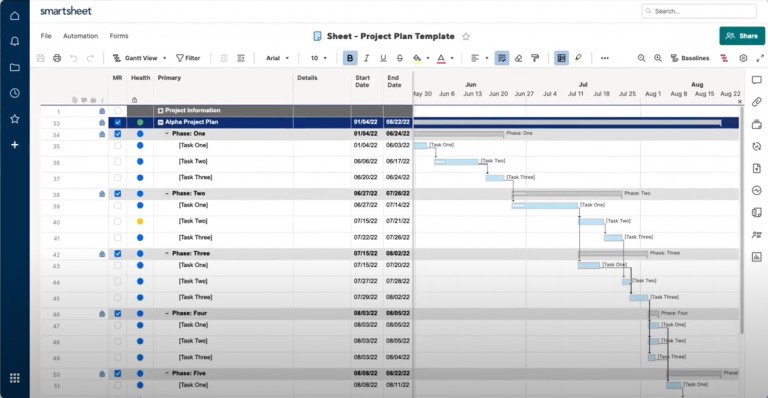
A Gantt chart is a visual tool in project management that lays out tasks along a timeline. It shows start and end dates, task dependencies, and progress, and is a go-to for understanding a project’s schedule and resource allocation.
The right Gantt chart software can be a game-changer. Some tools offer drag-and-drop scheduling, real-time collaboration, and task dependencies, which can make project management more efficient by streamlining planning and aligning teams.
To help you decide on the best software for your needs, here’s our hand-picked list of the top Gantt chart tools and what sets them apart:
- monday.com is best for visualizing project timelines with Gantt charts.
- Wrike is best for real-time Gantt chart updates.
- TeamGantt is best for ease-of-use and intuitive interface.
- GanttPRO is best for cost-effective task management.
- Instagantt is best for comprehensive scheduling and team collaboration.
- Toggl Plan is best for simple and straightforward project tracking.
Featured partnersFeatured Partners
Our picks for the top Gantt chart software
monday.com: Best for visualizing project timelines with Gantt charts
Pros
Cons
Also read: How to Create a Gantt Chart in Excel
Wrike: Best for real-time Gantt chart updates
Pros
Cons
Also read: Wrike vs. Asana Review
TeamGantt: Best for ease-of-use and intuitive interface
Pros
Cons
Also read: How to Use an Agile Gantt Chart for Project Management
GanttPRO: Best for cost-effective task management

Pros
Cons
Also read: Best Free Project Management Software (2023)
Instagantt: Best for comprehensive scheduling and team collaboration
Pros
Cons
Also read: 3 Ways to Plan Quality Management in Projects
Toggl Plan: Best for simple and straightforward project tracking

Pros
Cons
Also read: Best Microsoft Project Alternatives
Find your new Gantt chart software
Gantt chart software FAQs
Tips and best practices for using Gantt charts
Even the most powerful tools need to be used wisely to deliver their maximum potential. Gantt charts are no exception. Here are some tips and tricks for effectively using Gantt charts to drive your project management success.
Choosing the right Gantt chart software
The right Gantt chart software should be a seamless extension of your project management needs. Remember, a tool’s power lies in how well it aligns with your specific requirements.
- If you’re seeking a Gantt chart experience that can flex with your projects, monday.com‘s Gantt charts allow for customizable timelines and an intuitive drag-and-drop interface.
- If you require Gantt charts that map out complex projects and dependencies, Wrike‘s Gantt chart feature provides in-depth planning tools and real-time collaboration options.
- If you want to effectively manage your project timelines with a simple and intuitive interface, TeamGantt offers drag-and-drop Gantt charts and real-time collaboration.
- If you’re looking for a tool specializing in Gantt charts with a clean UI, GanttPRO offers features like task dependencies, milestones, and resource management.
- If a standalone Gantt chart solution that integrates seamlessly with Asana is what you need, Instagantt offers detailed task control and a critical path feature to keep your projects on track.
- If you need to manage your team’s workload with a visually appealing interface, Toggl Plan offers timeline views and simple drag-and-drop functionality.