Key takeaways
- A quality BI design informs an audience with the appropriate information requested, Intuitively tells a story, and includes a call for action.
- Great BI dashboards communicate information quickly using appropriate elements and data components, are easily customizable, and have a high usage rate.
- Complementary colors can highlight an important area on a dashboard with contrasting colors.
Business Intelligence (BI) dashboards must contain meaningful and structured information for the audience to view the dashboard effectively.
The most effective dashboards convey one message to an audience. The best way to convey one message is by keeping the dashboard simple. We’ll create an easily understood dashboard that conveys one message to an audience.
Why do you need to design your dashboard?
Designing a BI dashboard to meet a business requirement requires the dashboard designer to understand the purpose and the audience that will view the dashboard; the dashboard must be understandable and actionable.
The designer can use the appropriate dashboard elements to build a well-designed dashboard that makes the dashboard easy to understand with digestible information to make a recommendation or decision.
How to design a user-friendly BI dashboard

As a data visualization and analysis tool, Power BI dashboards provide intuitive visualizations that improve overall business productivity through fact-based decision-making. Listed here are the necessary steps to design user-friendly dashboards:
Know your audience
Before selecting a dashboard design, you need to consider the experience level of the audience viewing the dashboard. Knowing your audience will help you choose the layout and the type of jargon used in the dashboard.
If the audience is familiar with the topic, then technical jargon can be used, but if the audience is not familiar with the topic, then layman’s terms are preferred. Knowing your audience will help keep you focused on relevant information specific to their needs.
Identify the dashboard reporting requirement
Identify the purpose of the visualization dashboard and what data needs to be analyzed to help decision-makers make the best decision. A dashboard designer must capture the five “Ws,” who, what, when, where, and why a dashboard is needed. The five responses should all relate to the purpose of creating the dashboard.
Using dashboard templates
Knowing the type of information you want to present to an audience will help you choose a suitable dashboard template. Types of dashboards include:
⦁ Strategic: A strategic dashboard is generally used for measuring an organization’s overall strength and wellness and aggregates data from different business data sources to evaluate the well-being of a business.
⦁ Analytical: Analytical dashboards focus on specific business processes within a given period. For example, you are measuring the throughput of an assembly line making widgets. Every action before the widget material arrives at the assembly line to the packaging of the widget to include shipping and delivery to the final selling locations is a part of the analysis.
⦁ Operational: Operational dashboards focus on one KPI in a process. Operational dashboards are flexible enough to evaluate the real-time operations of an entire business. Still, they generally focus on analyzing one business process and assessing the KPI associated with a specific business process.
⦁ Tactical: This type of dashboard focuses on an organization’s internal processes to gain insight into weekly trends and metrics to improve internal communication. Tactical data analysis helps formulate mid to long-term strategies across an entire business.
Design dashboards to avoid clutter
Selecting the proper dashboard layout will help avoid cluttering your dashboard. Properly designed dashboards should show their intent and purpose within five seconds of an end-user looking at the dashboard. Consistent alignment and intentional and unintentional white space are all best practices for avoiding clutter.
In addition, using contrast and the availability of white space draws a viewer’s attention to the point of emphasis item on a dashboard. Gestalt Principles of Visual Perception help define visual design that covers images, space, layout, and color to avoid cluttering.
Place the most important information near the top
The most important visual or keywords that indicate what the dashboard visualization is about must be near the top left side of the dashboard. The visuals you use should be charts or graphics that an end user can read and interpret. When using complex graphic visuals, proper titles and labels should help the end user catch the overall intent of a dashboard.
Provide useful contextual information together
Providing context with visual dashboard information should include meaningful quantitative data like milestones, business metrics, and comparison information from year-to-year or month-to-month periods to help clarify the visual and understand any trends. Displaying meaningful information together helps managers make decisions quickly.
Conclude with a decision or recommendation
If all the information you want to present cannot fit on one dashboard, create another one. The best visual dashboards limit the number of metrics associated with a visual dashboard. So before an end-user gets to the end of your dashboard, they should already have an indication of the impending decision or recommendation.
What makes a BI dashboard meaningful to businesses?
BI dashboards are used to help managers make quick and accurate decisions. The intended audience or stakeholders should easily understand a well-designed dashboard. Listed are the quick ways BI dashboards help businesses:
Enhances businesses performance
Business improvements occur using automated analytics, compiled data insights, contextual analytics, and storytelling.
⦁ Automatic analytics uses AI and machine learning (ML) embedded in the dashboard to automatically monitor and identify critical changes that typically will not be identified by a human.
⦁ Compiled data insights uses AI-generated information and comparisons that help business managers make data-driven decisions.
⦁ Contextual analytics uses embedded data science modeling that triggers related workflows with recommended actions for an end user.
⦁ Storytelling combines a long-form narrative with charts and data visualization information to tell the end-user a story.
Makes quick adjustments
By using one of the four analytical methods combined with the ability to filter dashboard information, management can review the same information differently. As a result, management can extract relevant information to make quick adjustments to align with business objectives or goals.
Improves judgment and decision making
BI dashboards analytical tools remove intuition, gut feelings, and past year’s decisions from the decision-making process. Instead, BI dashboards allow managers to make data-driven decisions that are current and accurate.
Recognizes trends and patterns
BI dashboards analytical tools can identify trends and patterns that a human cannot do. Recognizing patterns and trends in analyzed data offers another decision-making capability that BI dashboards provide managers to help them make smarter data-driven decisions.
Collates relevant data together
One of BI dashboards’ strengths is associating all relevant data during the analytical process using advanced statistics, predictive analytics, and data mining tools. The collated data can be patterns, trends, or outlier information that managers can use to make informed decisions.
Mistakes to avoid when creating a BI dashboard
Designing an excellent visual dashboard is not difficult, but it can be difficult if you don’t put enough forethought into the purpose or the audience viewing dashboard. Some of the common mistakes to avoid are the following:
Selecting the wrong chart
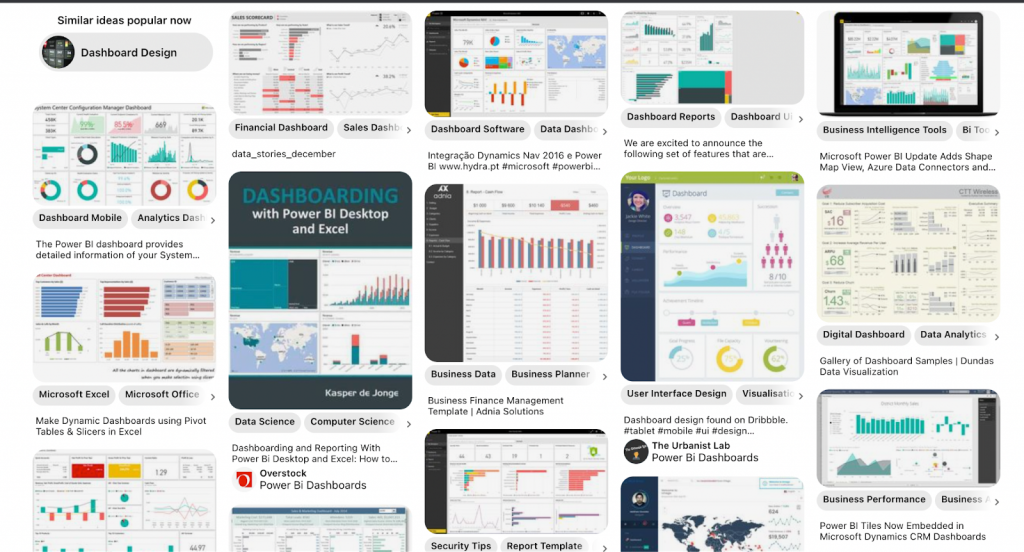
A common mistake is selecting the wrong chart. Chart selection becomes more complicated when variation in the data is very dispersed. To help make a chart selection decision, designers can search the internet for dashboard templates that have embedded charts. For example, the following website offers several dashboard templates with embedded charts: Dashboard templates.
Confusing labels
Labels should be descriptive of the dashboard element it’s associated with. Missing or confusing labels will make an audience guess what you are trying to convey. Additionally, having too many labels can be just as confusing as having no labels. Labeling should be limited to as few words as possible while still being descriptive.
Confusing page layout
Having too many dashboard elements on the dashboard layout is another design issue to avoid. Prioritize the essential elements you want to put in a layout by inserting those elements near the top left portion of your dashboard layout. Any relevant details can be added to the dashboard layout as long as the page is not cluttered.
Not providing complete information
A lack of information on a dashboard layout will be just as confusing as a mislabeled or cluttered dashboard. Any information on a dashboard should support the purpose of the dashboard. The best way to see if you provided enough information on a dashboard is to do peer reviews from co-workers before presenting your dashboard to the intended audience.
Cluttered dashboards
A cluttered dashboard is easy to do, especially when you want to do a good job. Anytime too much information is on a dashboard, it leads to confusion. The best way to prevent a cluttered dashboard is to keep it clean and concise with elements and labels associated with its intended purpose. Any element added to a dashboard should have the designer constantly asking how the added element or label supports the purpose and intent of the dashboard.
Too many colors
The audience will be distracted whether it’s too many elements or colors on a dashboard. So whatever colors you choose, consider colors that complement each other. You can also use complementary colors to contrast a particular area on the dashboard to capture the audience’s attention.
What are the benefits of using dashboards?
Dashboards are created from real-time and relevant data with easy access to updated information. Dashboards can track and monitor essential business metrics ranging from sales and customer attrition to workforce productivity.
Here are some other benefits of using a BI dashboard:
⦁ Easy access to essential at-a-glance information: Quick and easy access to critical information helps a business make better decisions using relevant information
⦁ Key Performance Indicator (KPI) tracking: BI dashboards allow managers to regularly review analyzed data associated with a business’s KPI goals.
⦁ Quicker identification of trends, anomalies, or outlier information: Provided tools help businesses make fact-based decisions by identifying potential problems and implementing changes to eliminate or minimize problems.
⦁ Promotes collaboration with substantiated data: BI dashboards provide accurate and up-to-date information used to evaluate different business sections for overall improvement in the business processes.
⦁ Intuitive reporting and assessment reporting: BI dashboards quickly generate customizable reports, assessments, and analyzed data results to meet managers’ needs for improved decision-making.
⦁ Accurate forecasting: Using predictive analysis tools on historical and current data, managers can project future demands and better strategize for future requirements.
Why are Business Intelligence (BI) dashboards so popular?
Smartly designed BI dashboards provide insight into large or complex data sets that are easy for an audience to digest and understand. Dashboards convert analyzed data into a pictorial representation that can show relationships between data sets, identify any outliers or anomalies in data sets, and visually track performance trends over time.
Dashboards are easily customizable to show specific information relevant to an audience. Additionally, dashboards promote stakeholder collaboration and allow for informed decision-making that enhances business outcomes.
Looking for the latest in Business Intelligence solutions? Check out our Business Intelligence Software Buyer’s Guide.
Featured partners
FAQs
Why should I use a BI dashboard?
One of the primary reasons for using a BI dashboard is to communicate a specific point effectively and efficiently.
What are the elements of a great business intelligence dashboard?
Great BI dashboards can communicate information quickly using appropriate elements and data components. Customizability and a high usage rate are also indicators of a great dashboard.