Gantt charts are a great tool for seeing a bird’s-eye view of your project timeline. All the data you need is laid out in an easily digestible, visual format. A Gantt chart lays out your project’s tasks in horizontal bars representing each task’s start and end dates, as well as their duration. Gantt charts can also help visualize task dependencies, milestones, and a project’s critical path.
With online Gantt chart software, the static Gantt views of old have been simplified for all users and transformed into an interactive project tool. Teams use Gantt charts to collaborate on tasks while they work, and project leaders get a real-time, graphical view of progress.
Learn how you can modernize your planning and project management with online Gantt chart software.
 At this point, you’ll be able to indicate which tasks are milestones; milestones typically populate on the Gantt as diamond-shaped icons (at least, that’s the traditional way). These icons illustrate a clear path for major task deadlines, but they can also be used to indicate meetings and further planning efforts.
You can define your project baseline, as well as view planned and actual progress of your project. You can also color code the information to represent specific team members, tasks, or phases of the project.
At this point, you’ll be able to indicate which tasks are milestones; milestones typically populate on the Gantt as diamond-shaped icons (at least, that’s the traditional way). These icons illustrate a clear path for major task deadlines, but they can also be used to indicate meetings and further planning efforts.
You can define your project baseline, as well as view planned and actual progress of your project. You can also color code the information to represent specific team members, tasks, or phases of the project.

Stephanie Ray is the content director for ProjectManager.com. She develops strategies for digital content and UX products and has over 15 years experience leading all kinds of projects.
Why You Should Plan with Gantt Charts
You can use a Gantt chart throughout the lifecycle of a project, but it’s especially helpful during early planning stages. Gantt charts are ideal for planning and scheduling, because they help you envision the length of a project, decide what resources you’ll need, prioritize tasks. ALSO READ: Everything You Need to Know About Gantt Charts Your best bet is to use an online Gantt chart — not some static Excel sheet that can’t be easily shared or updated. As you compare options, look for a solution that is easy to use, updates in real-time, and integrates with any existing tools you use. You should also look for features like task-level sharing and commenting and drag-and-drop chart building.Tips for Getting Started
Project planning is far from easy, but it’s an important process that lays the foundation for success or failure. A Gantt chart can serve as a framework for plotting out the major milestones and goals of your project. By following the three Gantt charting steps below, you’ll create a more accurate and effective project plan.1. Know What You’re Planning
A Gantt chart is only as good as the information you put into it, so it’s crucial that you detail every process involved in the project. Figure out each step, every task, and how long each will take before you can complete the project. Then look at your resources and determine what will need allocation. Once these pieces are in place, you’ll want to prioritize tasks and decide the correct sequence. See if any tasks are dependent on others, and indicate these dependencies on your chart. You can collect smaller tasks under milestones to further breakdown the project into more manageable components.2. Get it on the Gantt Chart
As mentioned earlier, by taking all this disparate information and breaking it down into task lists, you can get a clear overview of your project and a better handle on managing it. Creating the visual Gantt chart is easy, if you have the right online project management software. After collecting the data from step one, the software will populate the Gantt chart automatically for you as you add tasks.
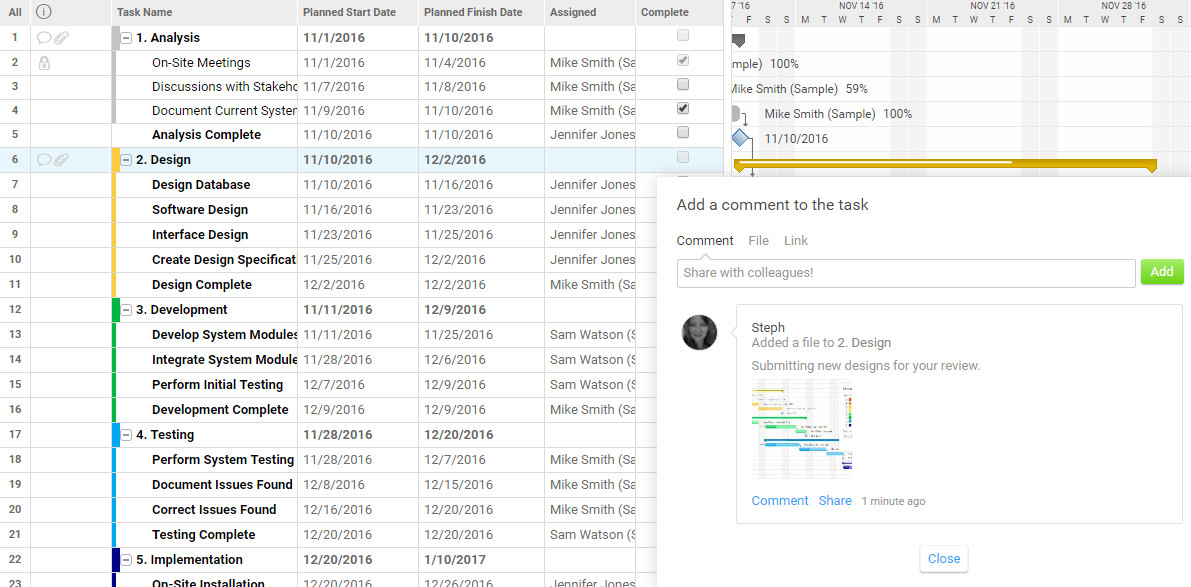
At this point, you’ll be able to indicate which tasks are milestones; milestones typically populate on the Gantt as diamond-shaped icons (at least, that’s the traditional way). These icons illustrate a clear path for major task deadlines, but they can also be used to indicate meetings and further planning efforts.
You can define your project baseline, as well as view planned and actual progress of your project. You can also color code the information to represent specific team members, tasks, or phases of the project.
3. Share It With Your Team
The beauty of an online Gantt chart is how collaborative it can be. You can email the entire project plan or individual tasks to the team, who can comment and add files to share and discuss. Those conversations and file updates can take place right on the task level in your Gantt chart. This is especially useful if you’re working with distributed teams. Not only your team, but sponsors and stakeholders, can stay in the loop and voice their feedback.
* * *
Unlike the desert island of a desktop spreadsheet (which isn’t easily shared without having to manage change) an online Gantt chart can engage other team members with task updates and task management. If you plan and update the project together, you’re more likely to get buy-in from your team, which means they’ll be more driven to complete work on time. A Gantt chart is a powerful tool — one that can make project planning both simpler and more effective. Don’t be intimidated by its complicated appearance or its reputation as an old-school project management tactic. Try an online Gantt chart, and see how it can free you up to lead your project and not be led by it.Stephanie Ray is the content director for ProjectManager.com. She develops strategies for digital content and UX products and has over 15 years experience leading all kinds of projects.