Key takeaways
- Each HR dashboard serves a distinct purpose and is most effective when used at the right moment, such as during hiring surges, performance reviews, or retention challenges.
- HR dashboards only drive value when you interpret and work on the data and turn workforce trends into targeted decisions.
- Focusing on a small set of relevant, goal-driven metrics is more impactful than tracking everything so you can surface meaningful insights without data overload.
- Dec. 19, 2025: Hanna Sillo refreshed page elements for clarity and scannability, updated the key takeaways, added current data and statistics, expanded dashboard examples with real-world use cases, and introduced additional nuance on the role of HR dashboards.
- Mar. 29, 2024: Irene Casucian revised a few sections to improve the flow of information and added software solutions that include essential HR dashboards.
Featured partnersFeatured Partners
HR dashboards help organizations track and analyze workforce data in real time so HR teams and leaders can make informed, data-driven decisions. This article covers the five most common types of HR dashboards—executive HR, recruitment, employee performance, workforce demographics, and turnover dashboards—with examples of what each includes, who should use them, and how they support a productive workforce.
Top HR dashboard examples
HR dashboards display a concise and accurate company workforce status in different aspects. Here are some top HR dashboard examples and how they can help maintain a productive, efficient workforce.
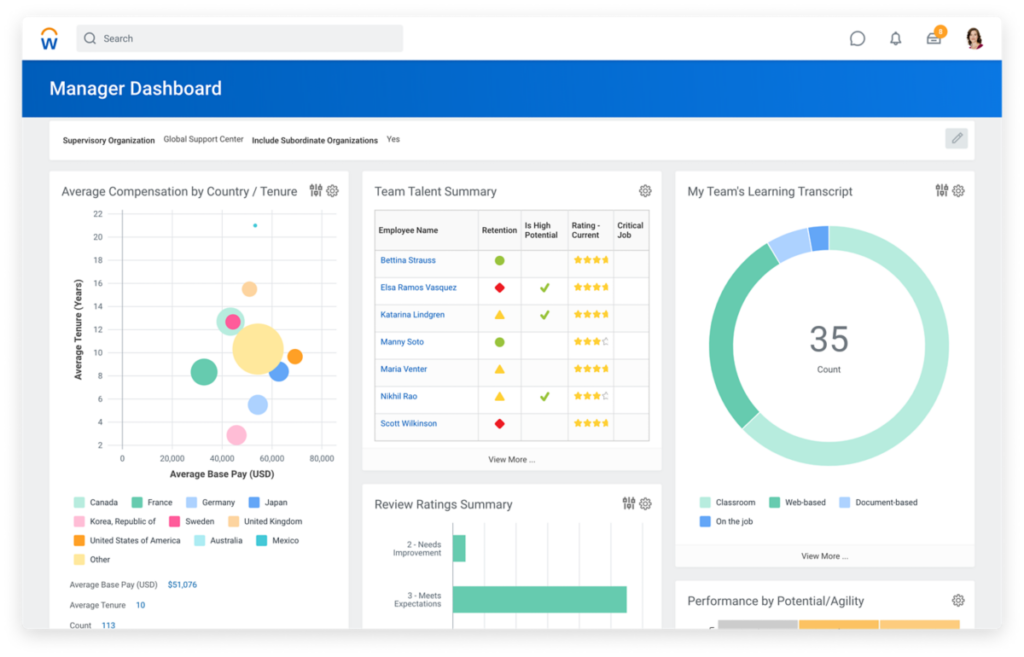
Executive HR dashboard
HR executives need an intuitive yet general overview of HR-related data for monitoring purposes. HR executive dashboards help HR leaders analyze all critical metrics in one view. The precise combination of metrics depends on the organization’s HR priorities, such as role or location distribution, average salary, employee satisfaction score, and turnover rate.
Executive dashboards give managers and team leaders an intuitive overview of their team’s composition, performance metrics, compensation, development opportunities, and other metrics. HR executives use these insights to make informed decisions and craft long-term goals for their organizations.
Best for:
- HR leaders
- Executive teams
- Department heads
An executive HR dashboard is especially useful during periods of change, such as rapid growth, restructuring, or budget planning, when leaders need a single view of headcount, turnover, compensation, and engagement. For example, during annual planning, executives can quickly see whether rising turnover in key roles or locations could impact business goals and adjust hiring plans, budgets, or retention strategies before issues escalate.
Example:
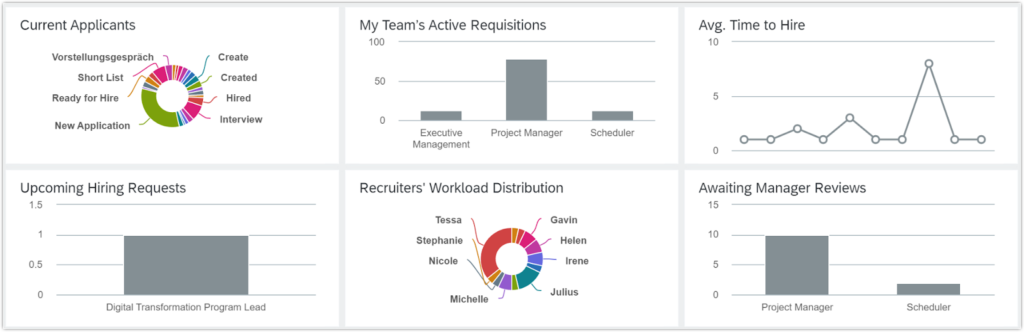
Recruitment dashboard
A recruitment dashboard helps hiring managers and recruiters answer questions related to hiring efficiency, overall costs, candidate engagement, and other critical dimensions that evaluate recruitment success.
A recruitment dashboard can help you decide whether to change your recruitment strategy. For example, if you notice frequent bottlenecks at certain stages in your hiring pipeline, you can use those trends to identify process inefficiencies, redistribute open roles among recruiters, and align expectations with hiring managers.
Best for:
- Hiring managers
- Talent acquisition team leads
- HR analysts
A recruitment dashboard is most helpful during periods of increased hiring or when roles are taking longer than expected to fill. For example, if open positions remain unfilled for weeks despite a strong applicant pipeline, recruiters can use the dashboard to identify where candidates are dropping off (such as after interviews or offer stages) and adjust sourcing channels, interview timelines, or hiring manager expectations to reduce delays.
Example:
Employee performance dashboard
An employee performance dashboard can provide supervisors and HR executives with high-level data about top performers, underperformers, flight risks, and other factors related to the workforce’s overall performance. Employees themselves can also use these dashboards to keep tabs on their own performance—this transparency minimizes surprises during performance management conversations.
This dashboard should include all relevant performance metrics like productivity, output quality, attendance, and punctuality. By learning the trends of these metrics, managers can decide whether there’s a need for supplementary training or coaching.
Best for:
- Team leaders and managers
- Performance coaches
- Individual contributors
An employee performance dashboard is most helpful during performance review cycles or when managers notice uneven results across teams. For example, if one team consistently misses goals while another exceeds expectations, the dashboard helps managers compare performance trends, attendance, and workload data to determine whether gaps are caused by skill needs, resource constraints, or unclear expectations and address issues before they affect morale or retention.
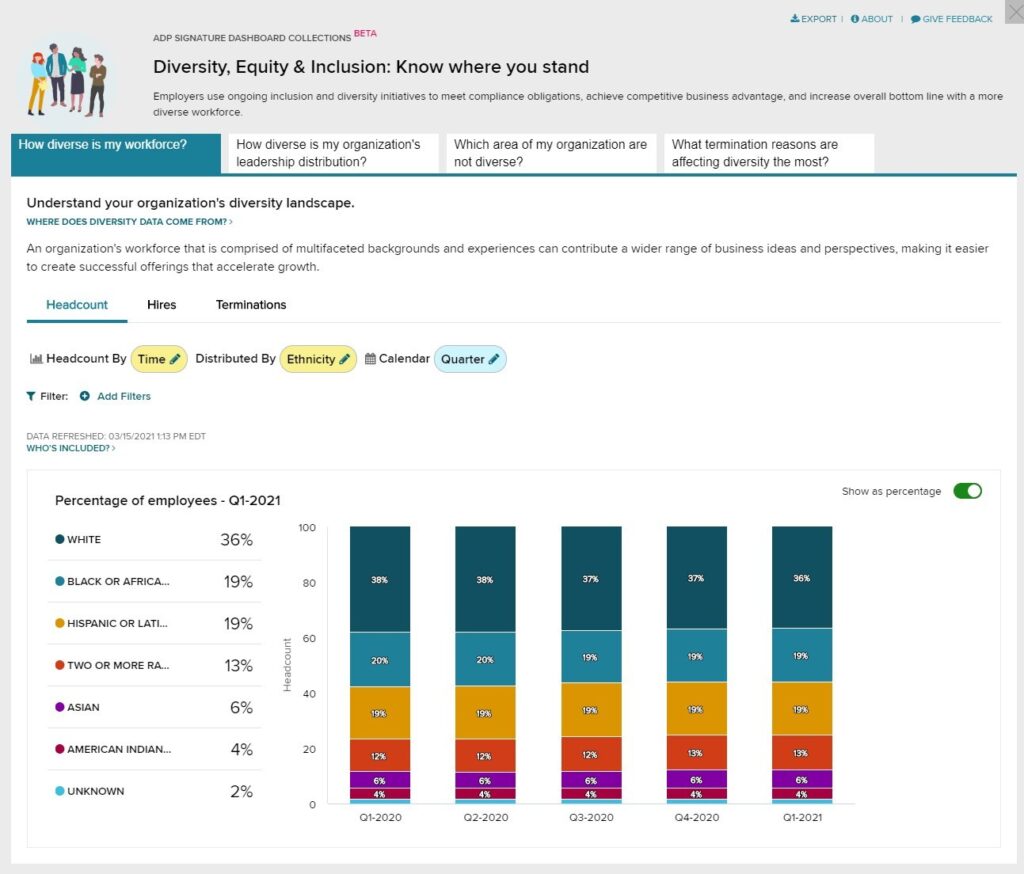
Workforce demographics dashboard
Many U.S. companies are reassessing or scaling back DEI initiatives amid political and legal pressure. Resume.org’s 2025 data shows that about one in eight organizations plan to reduce or eliminate DEI programs. Does this make demographics dashboard irrelevant? It’s quite the contrary.
Turnover dashboards segmented by demographic data are even more critical now in helping HR teams spot emerging retention gaps that might otherwise go unnoticed as formal DEI initiatives evolve.
Workforce demographics dashboards visualize data about your staff, including:
- Age
- Gender
- Ethnicity and cultural background
- Tenure
- Geographical location
- Disability status
- Educational background
This information is useful for spotting emerging workforce trends and keeping an eye on EEOC guidance. Workforce demographics dashboards also combine this data with information about hiring, compensation, engagement, and other HR initiatives. This is helpful for keeping biases in check and tracking DEI metrics like pay equity, accessibility, and retention.
Without effective workforce demographics dashboards, unbiased decision-making is virtually impossible.
Best for:
- Diversity and inclusion officers
- HR policymakers
A workforce demographics dashboard is most helpful during DEI planning, compliance reviews, or compensation audits. For example, when preparing for an annual pay equity review, HR leaders can use the dashboard to compare compensation, promotion rates, and retention across demographic groups, helping them identify disparities early and take corrective action before they become legal or reputational risks.
Example:
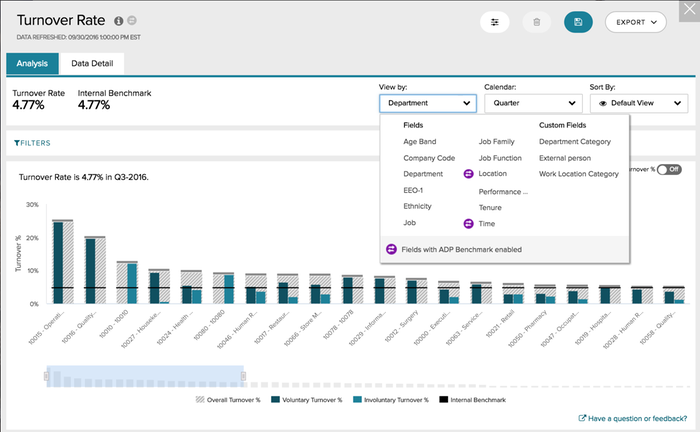
Turnover dashboard
If not kept in check, the cost of turnover can get out of hand. To track and analyze turnover data, HR managers and executives need to check the turnover dashboard regularly. This dashboard may include the following details:
If not kept in check, the cost of turnover can get out of hand, both financially and operationally. For example, Gallup research shows that about 42% of employees who voluntarily left their organization in the past year said their manager or employer could have done something to keep them from leaving. This underscores how turnover isn’t always inevitable and why tracking it closely matters.
Here are some numbers to monitor:
- Overall turnover rate
- Voluntary vs. involuntary turnover
- Turnover rate by department
- Turnover rate by tenure
- Turnover rate by demographic
- Cost of turnover
Turnover dashboards allow you to identify turnover patterns, pinpoint problem areas, and develop retention strategies to reduce turnover costs.
Best for:
- HR managers
- Executive leaders
A turnover dashboard is most helpful when an organization notices rising attrition or unexpected exits in specific roles or departments. For example, if voluntary turnover increases among employees with one to three years of tenure, HR teams can use the dashboard to analyze exit patterns by manager, role, or location and prioritize targeted retention efforts before turnover spreads or costs escalate.
Example:
HR dashboards are supports, not answers
HR dashboards surface patterns and risks across the workforce, but their real value lies in how leaders interpret the data and act on it, not in the charts themselves. To get the most out of dashboards, HR teams should pair metrics with context by asking what’s driving the trend, who it affects most, and what action the data should inform, rather than reviewing numbers in isolation.