Key takeaways
- Dashboards turn complex data into actionable insights, enabling faster and smarter decision-making across various industries. (Jump to Section)
- Effective dashboard creation requires defining clear metrics and audiences, choosing the right tools, and designing for clarity and impact. (Jump to Section)
- Three main types of dashboards serve different purposes: strategic, operational, and analytical. (Jump to Section)
Businesses generate massive amounts of data daily — but with the right tools, that data is just noise. A dashboard pulls data from multiple sources, turning raw information into clear, actionable insights. It allows teams and businesses to make faster and smarter decisions, whether for tracking sales, monitoring IT systems, or understanding market trends.
This article explains what dashboards are, how they work, and best practices for designing effective dashboards.
What is a dashboard?
A data dashboard is a visual tool that shows a snapshot of the most essential metrics pulled within your company or organization. Dashboards pull data from various resources and display it in one place, organizing essential information such as sales figures, website traffic, or IT system performance into digestible charts, graphs, and tables.
Dashboards allow you to drill down into more in-depth reporting, turning data into an accessible resource that will help sales leaders, IT managers, and business owners turn data into an accessible resource to aid them in making quick yet mindful decisions.
A dashboard can include as many or as few metrics as your team or organization needs. Different industries use dashboards because they’re highly customizable and can include all data types. Different date ranges help you understand what and why it happened, as well as predict what may happen and what action you can take.
For example, imagine a company’s executive team using a business dashboard: the CEO tracks overall revenue, the CFO monitors expenses and profit margins, and the marketing director evaluates campaign performance, all in real time. Instead of waiting for weekly reports, dashboards provide immediate access to insights, allowing them to adjust strategies, solve problems proactively, and respond to issues as they arise.
What is the purpose of a dashboard?
Data dashboards serve various purposes and audiences across various industries. Here are five primary purposes of data dashboards and how they relate to specific industries:
- Visualize complex data: Dashboards provide a more accessible way to present large datasets and help you organize and display data clearly and concisely through easy-to-read charts and graphs. In health care, dashboards can simplify patient care metrics for better decision-making.
- Real-time data tracking: Dashboards pull data from multiple sources and automatically update to daily syncs. In logistics, data dashboards unify real-time shipment tracking and inventory management data for more efficient operations.
- Improve decision-making: With real-time insights, teams and businesses can make more informed decisions based on accurate and complete data. For example, marketing teams can use dashboards to optimize their campaigns by analyzing ROI and conversion rates, while sales teams can adjust their strategies based on their pipeline health.
- Facilitate collaboration: Shareable dashboards prevent the likelihood of data siloing within teams and departments, as well as promote transparency by making critical information accessible to everyone. In retail, dashboards enhance coordination by sharing sales performance metrics through a centralized platform.
- Predict future trends: Dashboards use historical data to forecast future outcomes through predictive analytics. Businesses like manufacturing companies can predict production needs based on past demand trends, while financial institutions can use dashboards to forecast market trends and identify opportunities.
Types of dashboards
Three main types of dashboards serve a distinct purpose for specific audiences in a business or organization.
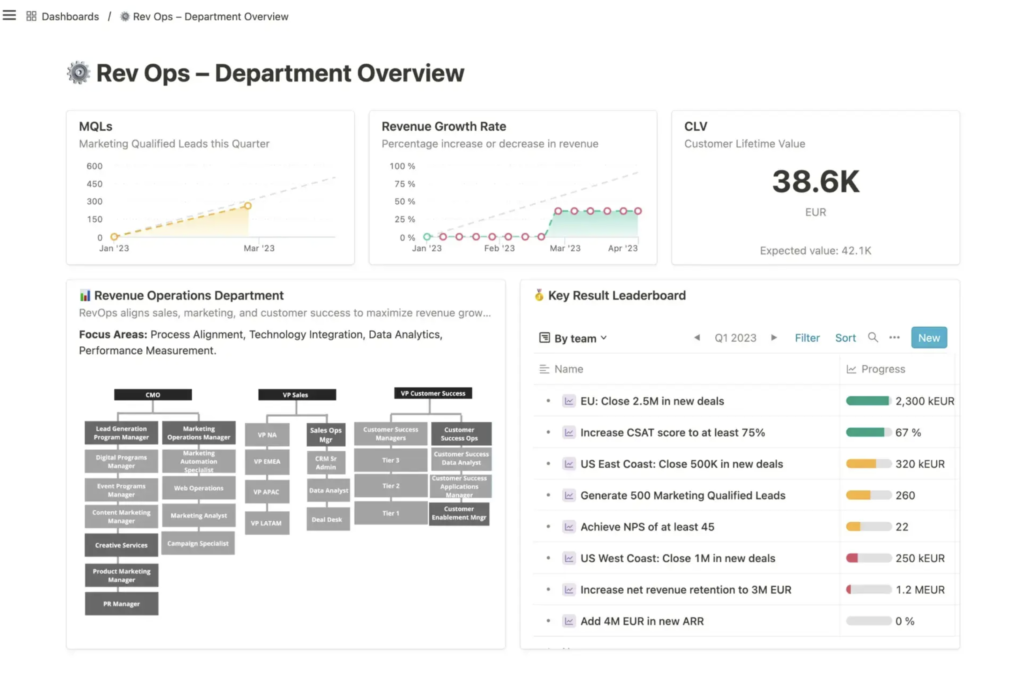
Strategic dashboards
Strategic dashboards monitor long-term company goals and key performance indicators (KPIs). Executives and senior management usually use this type of dashboard to gain access to high-level overviews of KPIs. These KPIs, which assess overall business performance, including market position and financial health, are updated less frequently than other metrics.
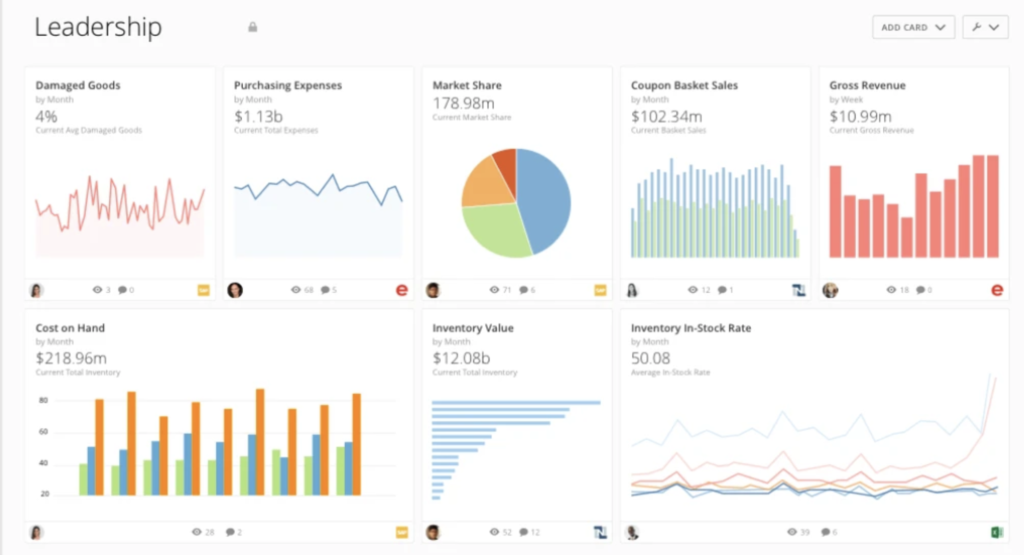
Operational dashboards
Operational dashboards track and optimize business operations, providing a snapshot of the company’s current state. Unlike strategic dashboards, this type of dashboard is updated more frequently and monitors real-time data for daily operations. These dashboards highlight metrics needing immediate attention and are usually accessed by operational staff or middle management.
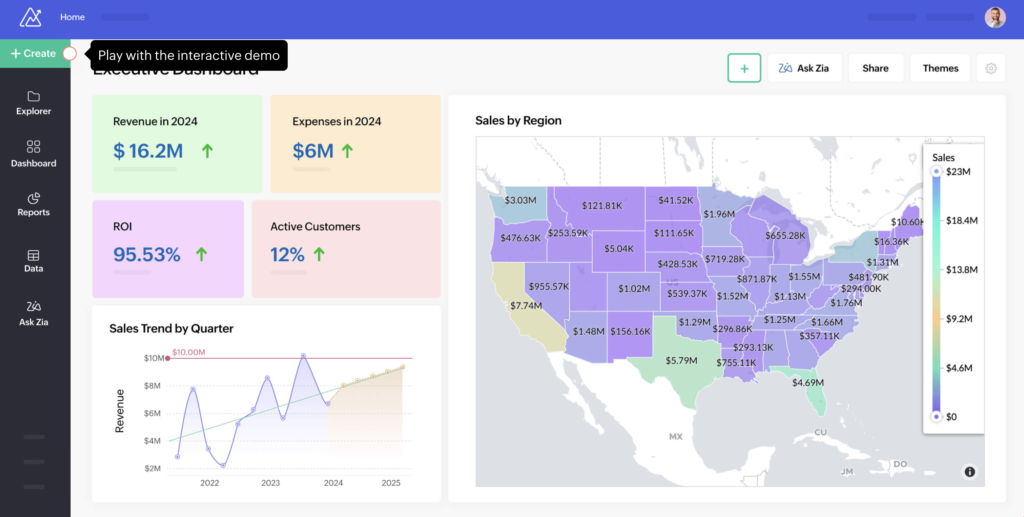
Analytical dashboards
Analytical dashboards process massive datasets to identify trends, patterns, and insights. This type of dashboard features an interactive interface that allows users to see headline information and filter it to find out the root cause of the issue. Data analysts and business intelligence professionals use AI-powered dashboards to combine real-time data from multiple resources and also assist in data preparation and analysis.
How to create a dashboard
Data dashboards provide a visual and interactive way to track key metrics and gain insights from your data. Creating an effective data dashboard requires careful planning and clearly understanding your goals. Here’s a step-by-step guide on how to make a dashboard:
- Clearly define your dashboard’s purpose, target audience, and KPIs. You can conduct surveys or stakeholder interviews beforehand to document possible data sources, desired metrics, and user needs.
- Prepare the necessary data in your chosen data visualization tool and ensure that these datasets are clean and organized.
- Visualize your dashboard’s layout through mockups and show it to your stakeholders for feedback.
- Build your dashboard structure effectively by choosing a suitable platform, whether it’s Excel or AI-powered tools, based on the complexity of your data and the needs of your stakeholders.
- Avoid clutter and maintain consistency when choosing visual elements for your dashboard. Before finalizing your dashboard design, use a design system that works for you, including colors, fonts, and spacing.
- Add reports to your dashboards based on the metrics you want to track and the objectives you want to achieve.
- Organize your content by regrouping metrics appropriately and adding filters if necessary.
Best practices for using dashboards effectively
Data dashboards provide a visual and interactive way to track key metrics and gain insights from your data. Creating an effective data dashboard requires careful planning and a clear understanding of your goals.
- Define your key metrics and target audience: Clearly define the KPIs you want to track based on your business objectives. Also, consider the needs and preferences of your target audience because the metrics should match their requirements and technical expertise.
- Choose the right tools: Once you’ve defined your key metrics and target audience, you should choose the visualizations that best represent your data and the right tool to use. The best data visualization tool should fit your budget and offer standard features for business intelligence, data visualization, and app integrations.
- Design for clarity and impact: Structure the layout logically and prioritize the most critical KPIs when creating your dashboard. Group related metrics together and use clear and concise labels to ensure your data is understandable.
Read our comprehensive list of the best dashboard software solutions to find the right tool that caters to your business needs and goals.