Many small business owners fall into the trap of running too many reports, thinking more data means better decisions. In reality, it often leads to the opposite. Important insights get buried under too much information, and key issues go unnoticed. Instead of trying to review every financial report for small business use, it’s more effective to focus on a small set of reports that directly impact profit, cash flow, and day-to-day operations.
- Track income and expenses with precision using built-in smart categorization.
- Easily generate tax-ready reports and manage quarterly filings.
- Integrate seamlessly with your existing tools and bank accounts.
- Enjoy support and flexibility tailored to businesses at every stage.
In this guide, I narrow down ten essential reports in QuickBooks Online that small business owners must review every month. My goal is to help you focus on the right information so you can spot problems earlier, make better decisions, and stay in control of your business.
1. Profit and loss statement
The Profit and Loss report summarizes your revenue, cost of goods sold, expenses, and net income for the month. It’s the clearest way to know if your company earned a profit. Think of it as your monthly report card. It tells you, in plain numbers, whether you’re winning or just staying busy.
When reviewing this report, focus on revenue trends, gross profit, and your largest expense categories. I suggest that you don’t look at the P&L statement of the current month only. Make a comparative analysis of the past three or four months to see if there are unusual changes. Look for anything that seems off, like a spike in costs or a dip in margins.
Expert Tip
Set a clear threshold for what counts as a meaningful change, even though that threshold will vary by business. As a starting point, treat expense movements above 10% as a trigger for review. For example, if the cost of goods sold increases by 14% in March, there should be a clear explanation. That increase might be driven by external factors, such as rising supplier prices tied to fuel costs, or internal issues, such as production inefficiencies, material waste, or spoilage.
Refine that threshold over time so it’s based on your actual data, not guesswork. Review historical expense patterns over several years and calculate the typical range of fluctuation. If the cost of goods sold has historically varied by around 13% annually, use that as a benchmark. From there, a 10–15% range may represent a normal swing, while anything outside that range signals a need for deeper investigation, especially when factoring in inflation and broader economic pressures.
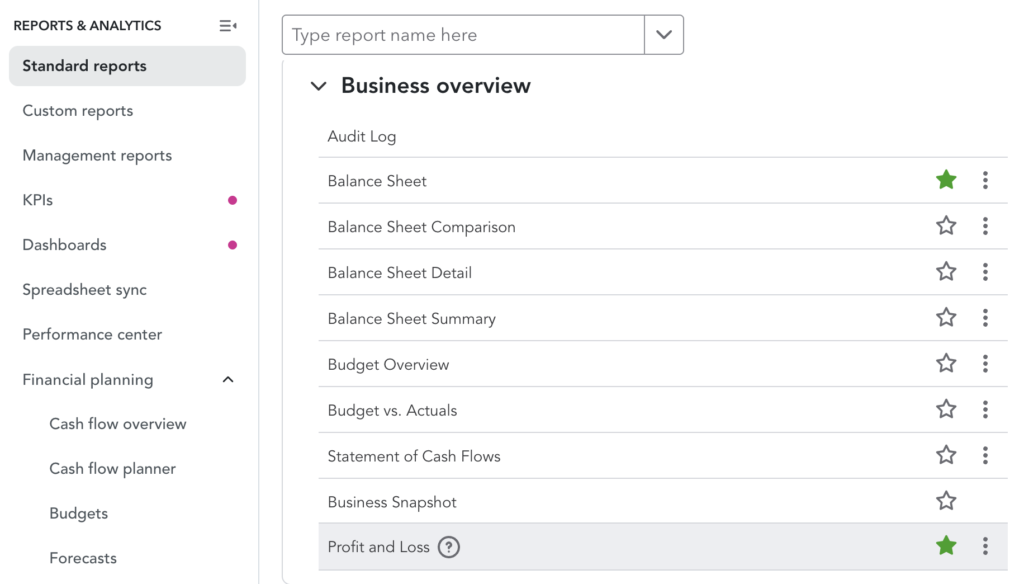
How to run it in QuickBooks Online: Go to the left navigation menu and click Reports. Search for Profit and Loss and open the standard report.
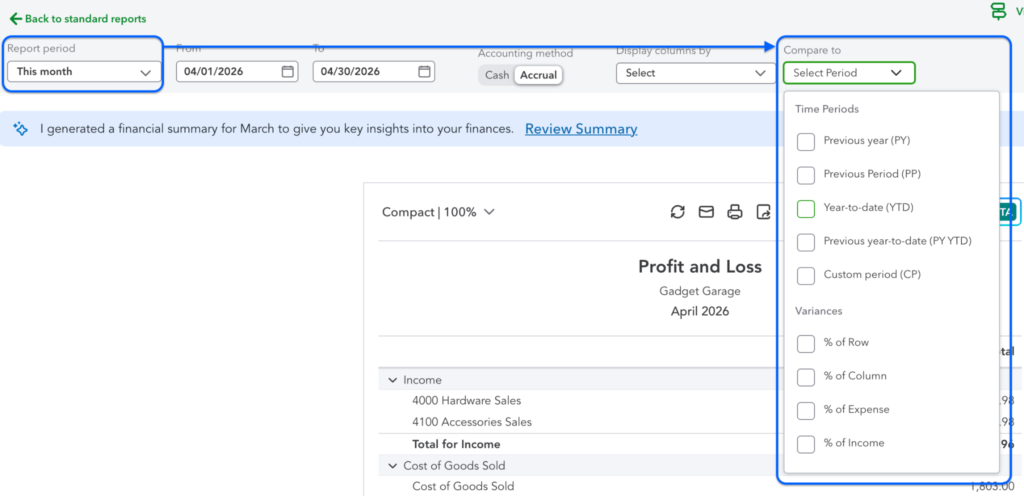
Set the Report period to the month you want to review. Use Customize to compare periods or adjust the layout, including showing columns by month if needed. Save the customized version so you can reuse it each month without rebuilding it.
2. Balance sheet
The Balance sheet shows your financial position: what your business owns, what it owes, and what’s left over for you as the owner at a specific point in time. Unlike the Profit and Loss report, which tracks performance over a period, this is just a snapshot.
Focus your monthly review on key balances: cash, accounts receivable, inventory (if applicable), loans, credit card balances, and accounts payable. Pay attention to how these numbers are changing over time. Rising receivables could mean slower collections, while increasing liabilities might signal growing financial pressure. These shifts often reveal issues that don’t show up clearly in your profit numbers.
Reading this report doesn’t make sense if you don’t compare it with previous periods. The best way to read this financial report for a small business is to compare it with previous periods and with variances. So if accounts receivable decreased but cash decreased as well, it signals a lot of things. It can be that sales are too low or expenses are too high, leading to a cash outflow.
Ultimately, this report helps you judge whether your business is financially stable, not just profitable. A company can show high net income but still struggle with cash shortages or excessive debt. The Balance sheet gives you a clearer view of liquidity, financial risk, and whether the business is actually building long-term value or becoming more strained.
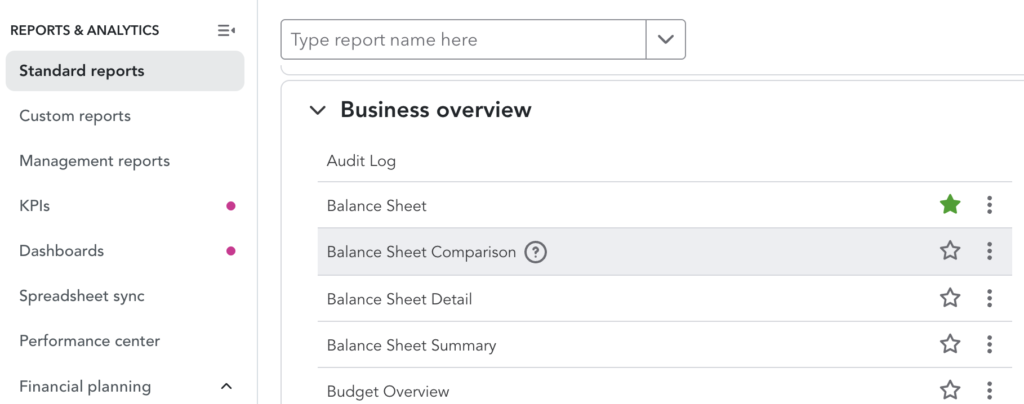
How to run it in QuickBooks Online: Go to Reports from the left navigation menu, then search for Balance Sheet and open the report.
Set the report date to the last day of the month you’re reviewing. Use Customize if you want to compare this period to a previous month or year. Click the star icon to save it to Favorites so it’s easy to access during your monthly review.
3. Statement of cash flows
The Statement of Cash Flows shows where your cash came from and where it went during the month. It breaks down cash movement into operating, investing, and financing activities, giving you a clearer picture of how money actually flows through the business. This is different from profit because you can be profitable on paper and still run into cash problems.
Review how much cash is coming from day-to-day operations versus other sources, such as loans or owner contributions. Normally, most of your cash must be coming from operations. Otherwise, cash coming in or out from investing or financing must be for a certain period only, not always. Pay attention to increases and decreases.
This report matters because it helps you avoid cash shortages before they happen. It shows you how cash flows in and out of the business, especially those “leaks” that can’t be spotted in the P&L statement. A strong cash flow from operations usually signals a healthy, sustainable business, while weak cash flow can point to deeper issues even if profits look fine.
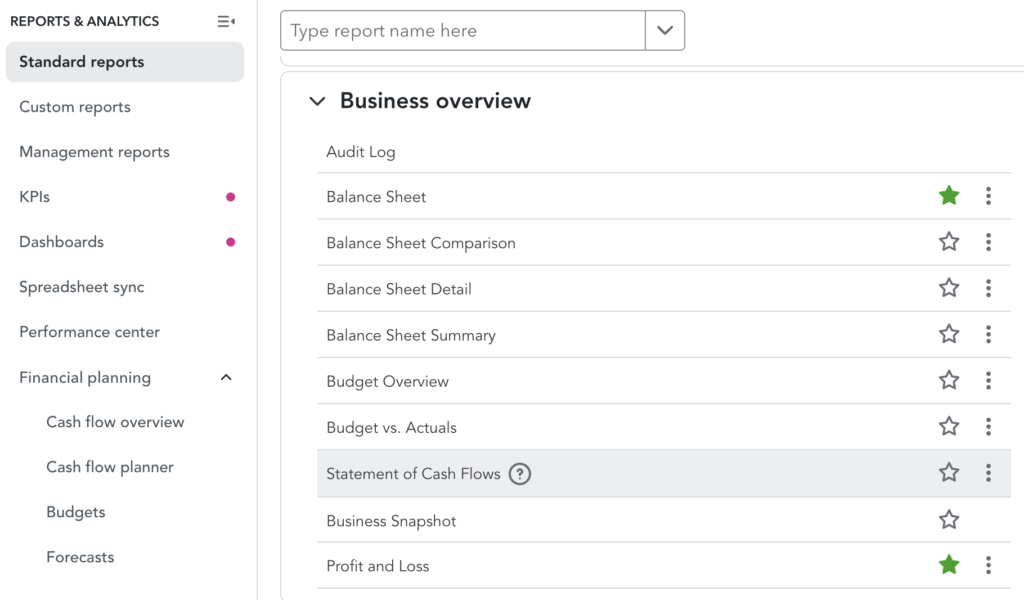
How to run it in QuickBooks Online: Go to Reports, search for Statement of Cash Flows (or Cash Flow Statement), and open it.
Set the report period to the month you’re reviewing. Check the net change in cash and the ending cash balance, then compare that ending balance to the cash shown on your Balance Sheet for the same date to make sure they match.
4. Accounts receivable aging detail
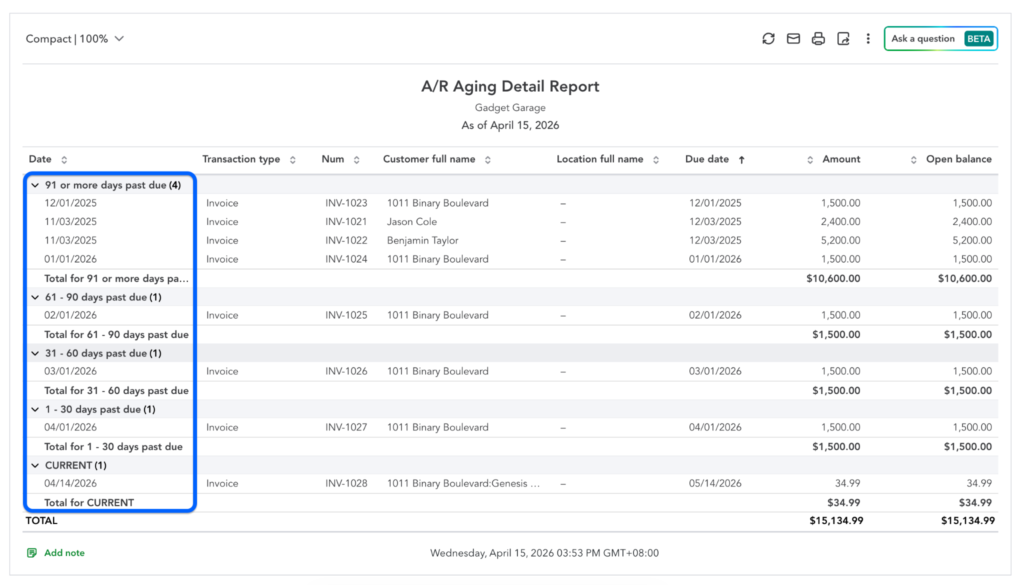
The Accounts Receivable Aging Detail report lists all unpaid customer invoices and groups them by how overdue they are. Groups are typically current (1-30 days), 31–60 days, or older. This report shows you how long balances have been outstanding, prompting you to take action in collecting those accounts.
Focus on overdue balances, especially invoices that keep moving into older aging buckets. Look for repeat late payers and customers whose balances are growing month after month. Pay attention to large outstanding amounts tied to a small number of customers, since that increases your risk if payments are delayed.
Examining this report helps you take action before receivables turn into cash flow problems. It also prevents you from extending credit to customers who are slow or late payers. Use it to prioritize follow-ups, send reminders, tighten payment terms, or decide whether to pause work for consistently late-paying customers. Staying on top of this report helps keep cash moving and reduces the risk of unpaid invoices piling up.
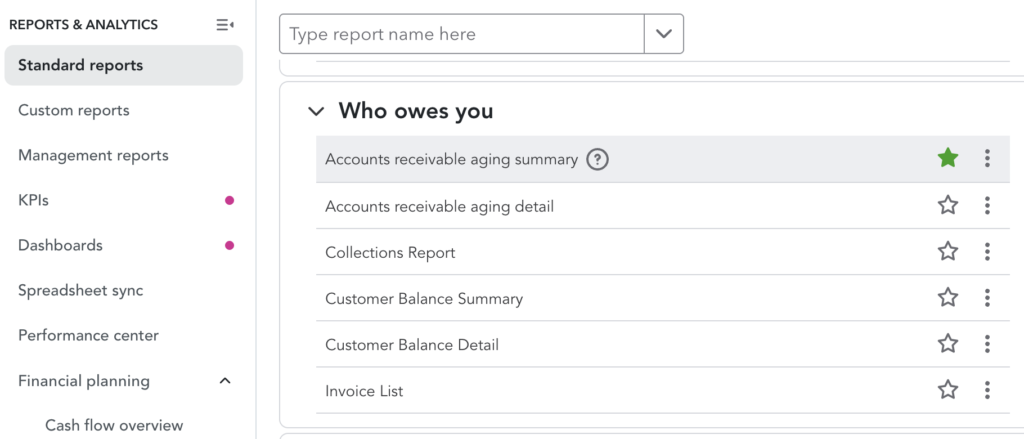
How to run it in QuickBooks Online: Go to Reports, then search for Accounts receivable aging detail. Open the report and set the As of date to the end of the month.
Review the aging columns by customer, and use Customize if you want to filter by specific customers or adjust the display. Save the report to reuse it as part of your monthly review.
5. Open invoices
The Open Invoices report provides a straightforward list of all customer invoices with unpaid balances. Use this alongside the A/R aging report, as it provides quick visibility into outstanding invoices, regardless of their age group. Think of this report as the master list of customers with open accounts.
Here’s how I’d use this report with the A/R aging report:
- I’ll start with the largest customer balances. Cross-reference each one with the A/R aging report to understand how urgent it is. If the balance is still current, decide based on timing — send a reminder if it’s close to the due date, or leave it alone if there’s still plenty of time.
- Send a reminder if it’s nearing the due date or
- Leave it for now if it’s far from the due date (e.g., >10 days)
- Next, I’ll shift my focus to smaller balances. Individually, they may not seem significant, but when combined, they can represent a meaningful portion of your receivables. Use the aging report to determine how aggressively to follow up.
- For one to 30 days overdue, send a friendly reminder and confirm the invoice was received. This is usually a timing issue, so keep the tone light and professional.
- For 31–60 days, follow up more directly. Ask for a payment timeline, resend the invoice, and make sure there are no disputes or issues holding up payment.
- For 61–90 days, escalate the conversation. Reach out via phone if possible, reinforce payment expectations, and consider pausing additional work until the balance is addressed.
- For 91 days or more, treat the balance as high risk. Consider stronger actions such as formal collection steps, stopping service, or reassessing the customer relationship altogether.
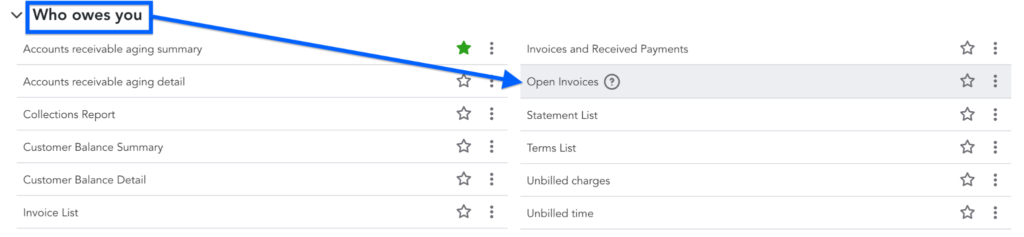
How to run it in QuickBooks Online: Go to Reports, search for Open Invoices, and open the report.
Set the date or As of view to the current month-end or today’s date. Sort by due date or customer to make it easier to review, and click into individual invoices directly from the report if you need more detail.
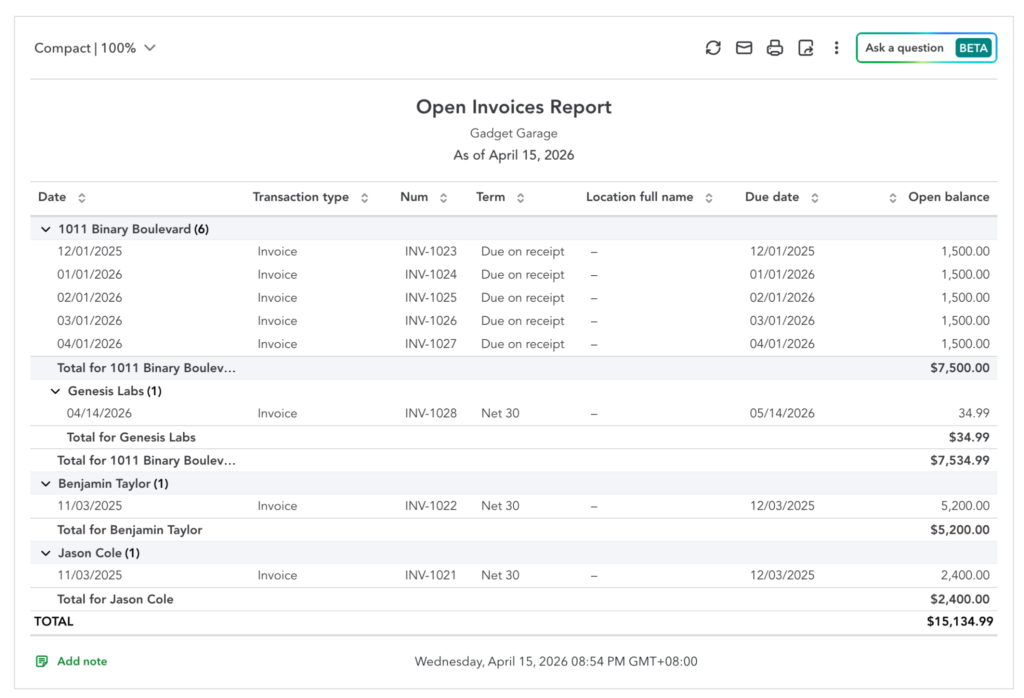
Here’s how I’ll read this report: I’ll focus first on the total open balance (i.e., $15,134) to understand how much cash is tied up in unpaid invoices, then prioritize customers with the largest combined balances since they pose the greatest cash flow risk. Then, I’ll check for patterns like multiple unpaid invoices from the same customer, which can signal ongoing work without payment, and compare due dates and terms to spot overdue accounts.
I’ll also look at older invoices, as they carry higher collection risk, and don’t ignore smaller balances that can add up over time. And finally, I’ll forward this report to the person in charge of sending follow-ups with my notes on which accounts to escalate or prioritize in collection.
6. Accounts payable aging summary
The Accounts Payable Aging Summary shows how much your business owes vendors and how long those balances have been outstanding. It groups unpaid bills into aging buckets similar to the A/R aging report, so you can quickly see which obligations are coming due and which are already overdue. Think of it as the flip side of your receivables report.
When reading this report, review overdue bills first, along with large balances due soon. Look for vendors with consistently growing balances or payments that keep slipping into older aging categories. These patterns can signal cash pressure or gaps in your payment process that need attention.
This report helps you stay in control of outgoing cash. It supports decisions about which bills to prioritize, how to time payments, and how to maintain strong relationships with key suppliers. Paying too late can damage trust or disrupt operations, while paying too early can strain your cash position—this report helps you strike the right balance.
How to run it in QuickBooks Online: Go to Reports, search for Accounts payable aging summary, and open the report. Set the As of date to the end of the month.
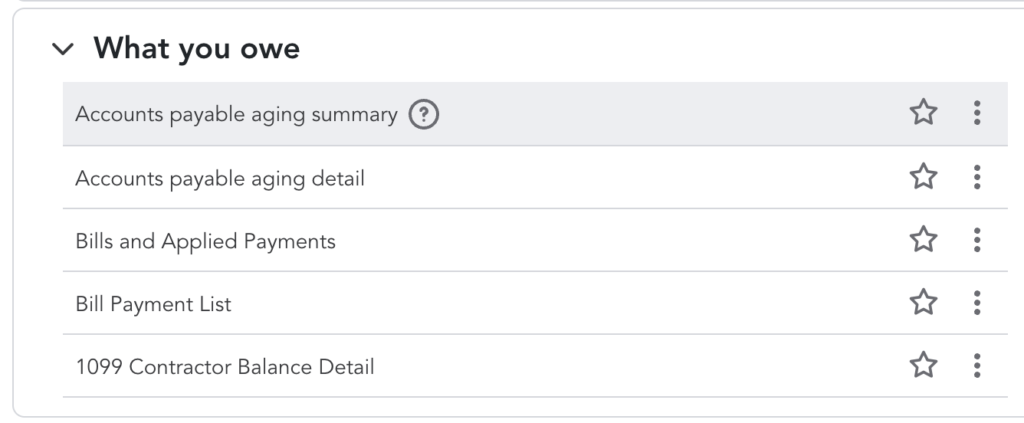
Review balances by aging category, and use Customize if you want to adjust columns or filter the report. Save it to Favorites for quicker access during your monthly review.
7. Sales by customer summary
The Sales by Customer Summary report shows how much revenue each customer generated over the selected period, giving you a clear view of where your income is coming from. It helps you understand whether your revenue is spread across many customers or concentrated in just a few, which directly affects how stable your business is.
Focus on your top customers first and how much they contribute to total revenue. Look for concentration risk—if a large percentage of your income comes from one or two clients, your business becomes vulnerable if they leave or reduce spending. Also, watch for declining sales from repeat customers or unexpected spikes that may not be sustainable. These patterns tell you whether your growth is stable or overly dependent on a few relationships.
This report matters because it shapes how you manage and grow your customer base. It helps you decide where to invest in retention, which clients to upsell, and whether you need to diversify your revenue sources. A healthy business isn’t just growing—it’s not overly dependent on any single customer.
How to run it in QuickBooks Online: Go to Reports, search for Sales by Customer Summary, and open the report. Set the Report period to the month you’re reviewing. Use Customize to filter by customer, class, or location if needed, and save the report if you want to include it in your monthly review workflow.
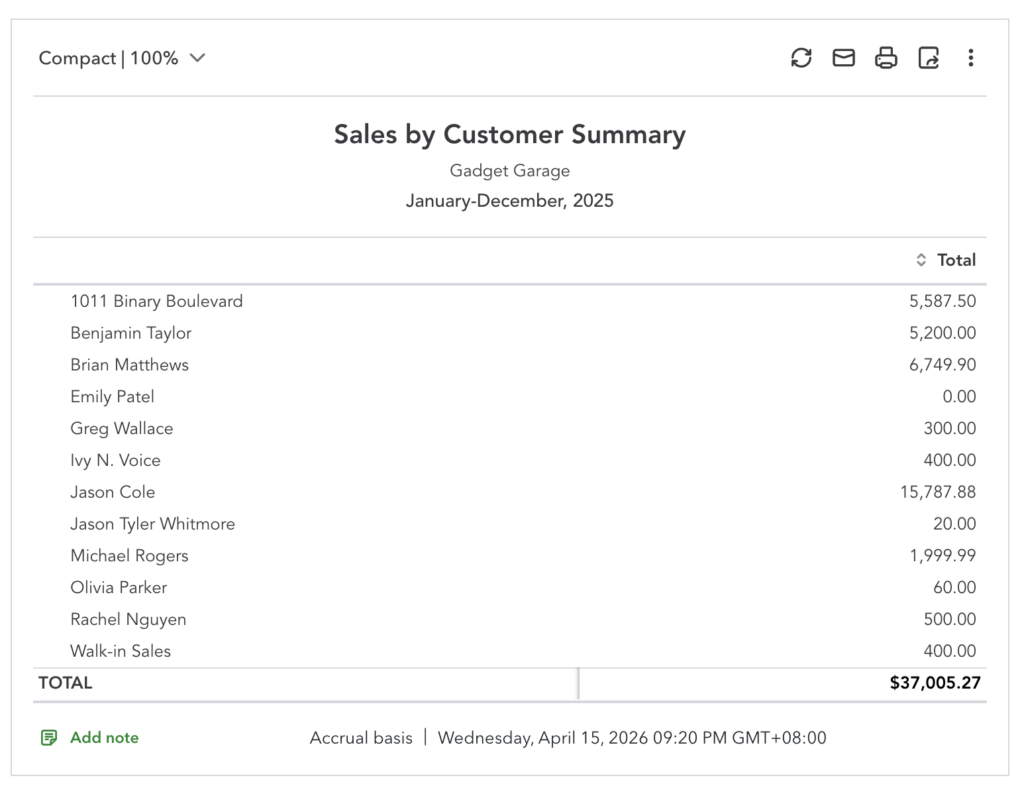
Most of the time, the summary report is all you need. It gives you a clear, high-level view of performance without getting lost in transaction-level noise. The detailed version is useful when you’re investigating something specific — like a sudden spike or a discrepancy—but for regular monthly reviews, the summary keeps things focused and efficient.
Use the Sales by Customer Summary to quickly identify your top customers. It’s helpful if you want to reward or prioritize them, but it’s just as valuable for spotting risk. If a previously top customer suddenly drops off or stops buying altogether, that’s a signal to dig deeper into whether it’s a retention issue, a shift in their needs, or a problem with your offering.
8. Expenses by vendor summary
The Expenses by Vendor Summary report groups your spending by vendor, showing exactly where your money is going each month. It gives you a clearer picture of your cost structure beyond categories, helping you see which suppliers and services drive your expenses.
A practical way to use the expenses by vendor summary is during your monthly review when you compare spending across vendors. Start by identifying your top three to five vendors by total spend, then check if those costs are consistent with prior months. If one vendor’s expenses increased, verify whether the increase is tied to higher business activity (e.g., more orders or production) or to other factors, such as duplicate charges, price increases, or unnecessary purchases.
You can also spot multiple vendors providing similar services, like two marketing tools or overlapping subscriptions, and decide whether to consolidate. This helps you control costs, avoid waste, and make sure your spending actually supports your operations.
How to run it in QuickBooks Online: Go to Reports, search for Expenses by Vendor Summary, and open the report. Set the Report period to the month you’re reviewing.
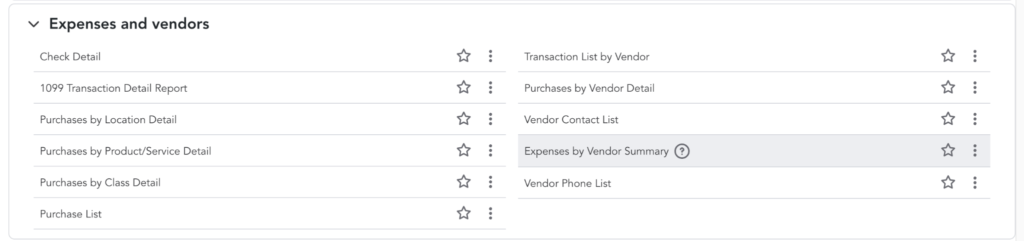
Use Customize to adjust filters or layout based on your needs, and save the report if you want quick access each month.
9. Budget vs actuals
The Budget vs. Actuals report compares what you planned to earn and spend against what actually happened during the month. It only works if you’ve set a budget in QuickBooks, but when used consistently, it turns your reports from hindsight into a tool for managing performance.
Focus on gaps between your budget and actual results. Look for revenue shortfalls, overspending in specific categories, and areas where performance exceeded expectations. When comparing budget vs. actuals, set a clear threshold for what constitutes a meaningful variance. As a starting point, treat any variance of around 10% (whether over or under budget) as something that should trigger a closer look or at least a question.
That said, the right threshold will vary by business. Use your historical data to understand what “normal” fluctuations look like, and adjust based on your experience and the stability of each category so you’re focusing on variances that actually matter.
How to run it in QuickBooks Online: Go to Reports, search for Budget vs. Actuals, and open the report. Select the budget that covers the month you’re reviewing. If no data appears, create a budget first in QuickBooks. Use Customize to adjust the date range or layout, and save the report for monthly use.
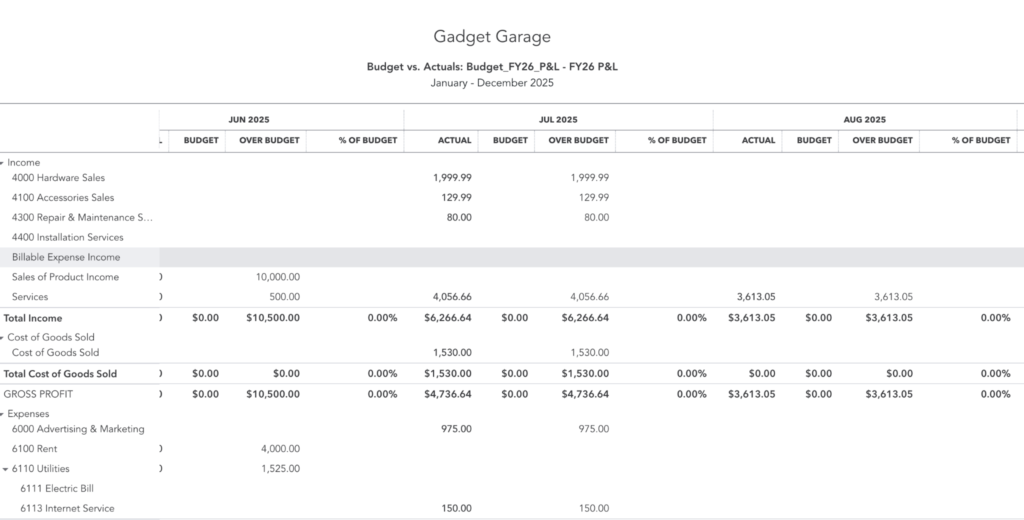
This budget vs. actuals report is structured to compare planned performance against actual results across time, using columns that repeat for each month (e.g., Budget, Actual, Over Budget, and % of Budget). Budget shows what was expected, Actual shows what really happened, Over Budget highlights the dollar difference between the two, and “% of Budget” puts that difference into context as a percentage.
The report is organized by account categories like income, cost of goods sold, and expenses, so you can see where variances are happening within your operations. Presenting it side by side and month by month makes it easier to quickly scan for gaps, spot trends, and identify which areas are consistently over- or under-performing without needing to calculate differences manually.
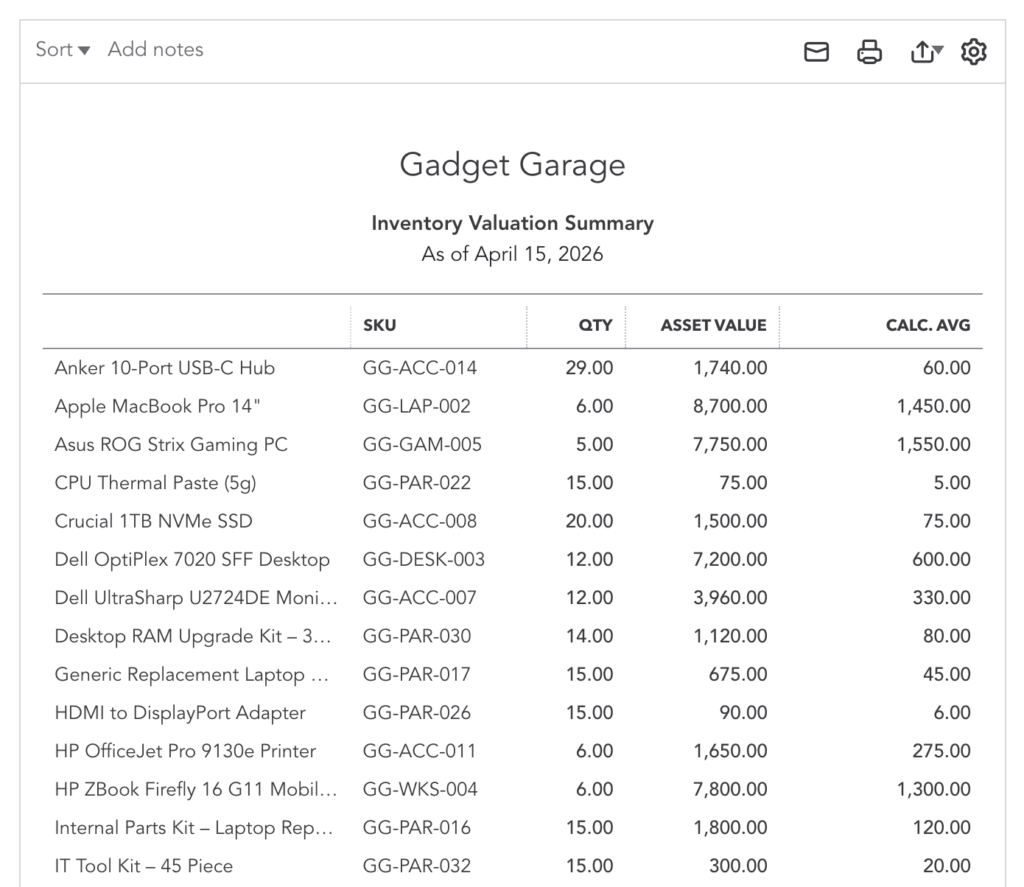
10. Inventory valuation summary
The Inventory Valuation Summary shows the quantity, average cost, and total value of your inventory at a specific point in time. It’s essential for businesses that sell physical products because inventory directly affects both cash flow and cost of goods sold.
Use this report to identify which items are tying up the most capital, which ones are barely moving, and whether your stock levels make sense relative to your sales. It helps you catch overstocking, avoid stockouts on high-demand products, and clean up slow-moving or obsolete inventory before it quietly eats into your margins.
This report matters because inventory is cash sitting on your shelves. Too much inventory ties up cash that could be used elsewhere, while too little can lead to missed sales. Regular review helps you make better purchasing decisions, maintain healthy stock levels, and protect your margins by keeping inventory accurate.
How to run it in QuickBooks Online: Go to Reports, search for Inventory Valuation Summary, and open the report. Set the report date to the end of the month.
If I were reviewing this as the accountant, I would first sort the report by total value to identify which items are tying up the most cash, since those have the biggest impact. I would then check whether those high-value items are actually selling at a reasonable pace; if not, I would flag them for reduced purchasing or possible discounting.
Next, I would look at quantities in relation to sales activity by comparing this report with sales reports like the sales by product summary or the profit and loss (specifically, the cost of goods sold). This helps identify items with high quantities but low sales, which are likely overstocked. I would also scan for anything that looks off, such as unusually high quantities or values that don’t match expectations, and then cross-check those items against purchase records or past reports to determine if it’s a data issue, shrinkage, or a real buildup of inventory.
Finally, I would use this review to guide purchasing decisions by recommending reorders for fast-moving items that are getting low and slowing down or pausing orders for items that are not moving, so cash is not unnecessarily tied up in inventory.